Dacity Coin
 Zcash
Zcash Sui
Sui Injective
 Quantus
 Pearl
Pearl NEAR Protocol

Key Insights:
- ETH trades below realized price, signaling possible capitulation phase.
- Spot Ethereum ETFs see $94M outflows in two weeks.
- Futures gaps suggest potential for short-term price reversal.
Ethereum (ETH) is trading on edge. After dropping below $1,500 this week, market structure, derivatives data, and on-chain trends now hint at an extended capitulation.
At the same time, a technical setup on Ethereum futures suggests a possible rebound—though historical parallels warn of further downside before any recovery.
ETH Breaks Below Realized Price: Capitulation or Opportunity?
According to on-chain data from CryptoQuant, ETH is now trading below its realized price. This metric, which reflects the average acquisition cost of ETH across wallets, sits above the current spot price, suggesting holders are underwater.
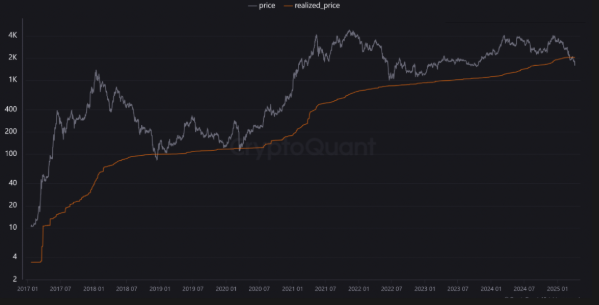
CryptoQuant contributor theKriptolik said this pattern often signals a capitulation phase. “Drops below the realized price often mark the capitulation phase, where investors lose confidence and begin selling en masse,” he wrote.
In previous cycles, ETH suffered steep drawdowns after breaching this level. In June 2022, the move preceded a 51% decline following the Terra Luna crash. A similar breakdown in Nov. 2022 came before a 35% plunge amid the FTX collapse.
Now, with ETH down 50% year-to-date, history may be rhyming again.
Ethereum ETF Demand Weakens, Outflows Pile Up
Investor appetite for Ethereum remains tepid. Spot Ethereum exchange-traded funds (ETFs) posted over $3.3 million in net outflows on Apr. 8, according to data from Farside Investors.
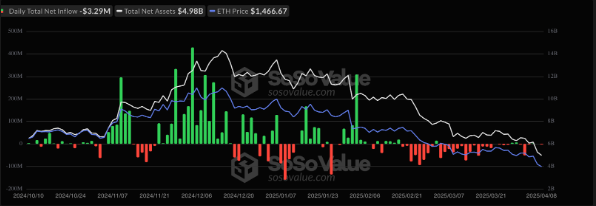
Total outflows for the past two weeks now stand at $94.1 million, while inflows are just $13 million. This weakness extends to all Ethereum-based investment products, with CoinShares reporting $37.4 million in weekly outflows through Apr. 4.
Institutional interest, which previously fueled price gains in May 2024 on optimism around the United States Securities and Exchange Commission’s ETF approval, now appears to have faded.
Open Interest Falls, Funding Rates Turn Bearish
In derivatives markets, ETH also shows signs of exhaustion. Data from CoinGlass puts current open interest across ETH futures at $16.7 billion—down 48% from the Jan. 24 peak of $32.3 billion.
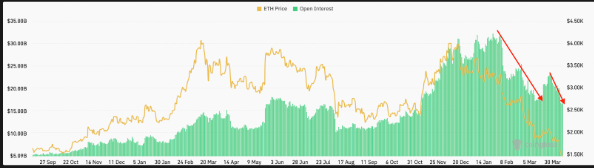
This drop suggests falling speculative interest. Meanwhile, funding rates across perpetual futures have turned negative, indicating short positions dominate.
Glassnode data confirms this shift. When funding turns negative, traders betting against price must pay longs to keep their positions open. This dynamic reinforces bearish sentiment and disincentivizes bullish leverage.
Futures Gaps Hint at Volatile Reversal Potential
On Apr. 9, pseudonymous trader Merlijn shared a chart showing four unfilled CME futures gaps between current ETH price and levels above $4,000.
“Ethereum has 4 major gaps waiting to be filled,” he wrote. “The most heated rally can start at any moment.”
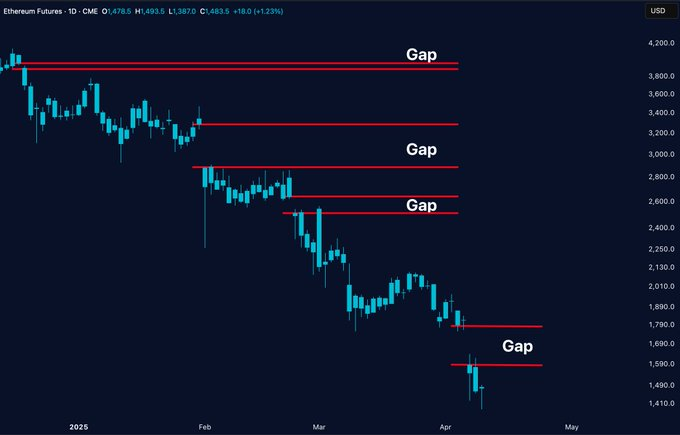
Historically, assets tend to revisit CME futures gaps, especially during trend reversals. The chart shows gaps at approximately $1,800, $2,600, $3,200, and $4,100.
Still, with ETH currently around $1,620, the distance to even the nearest gap remains wide.
Whale Moves and Inverse ETF Gains Highlight Bearish Pressure
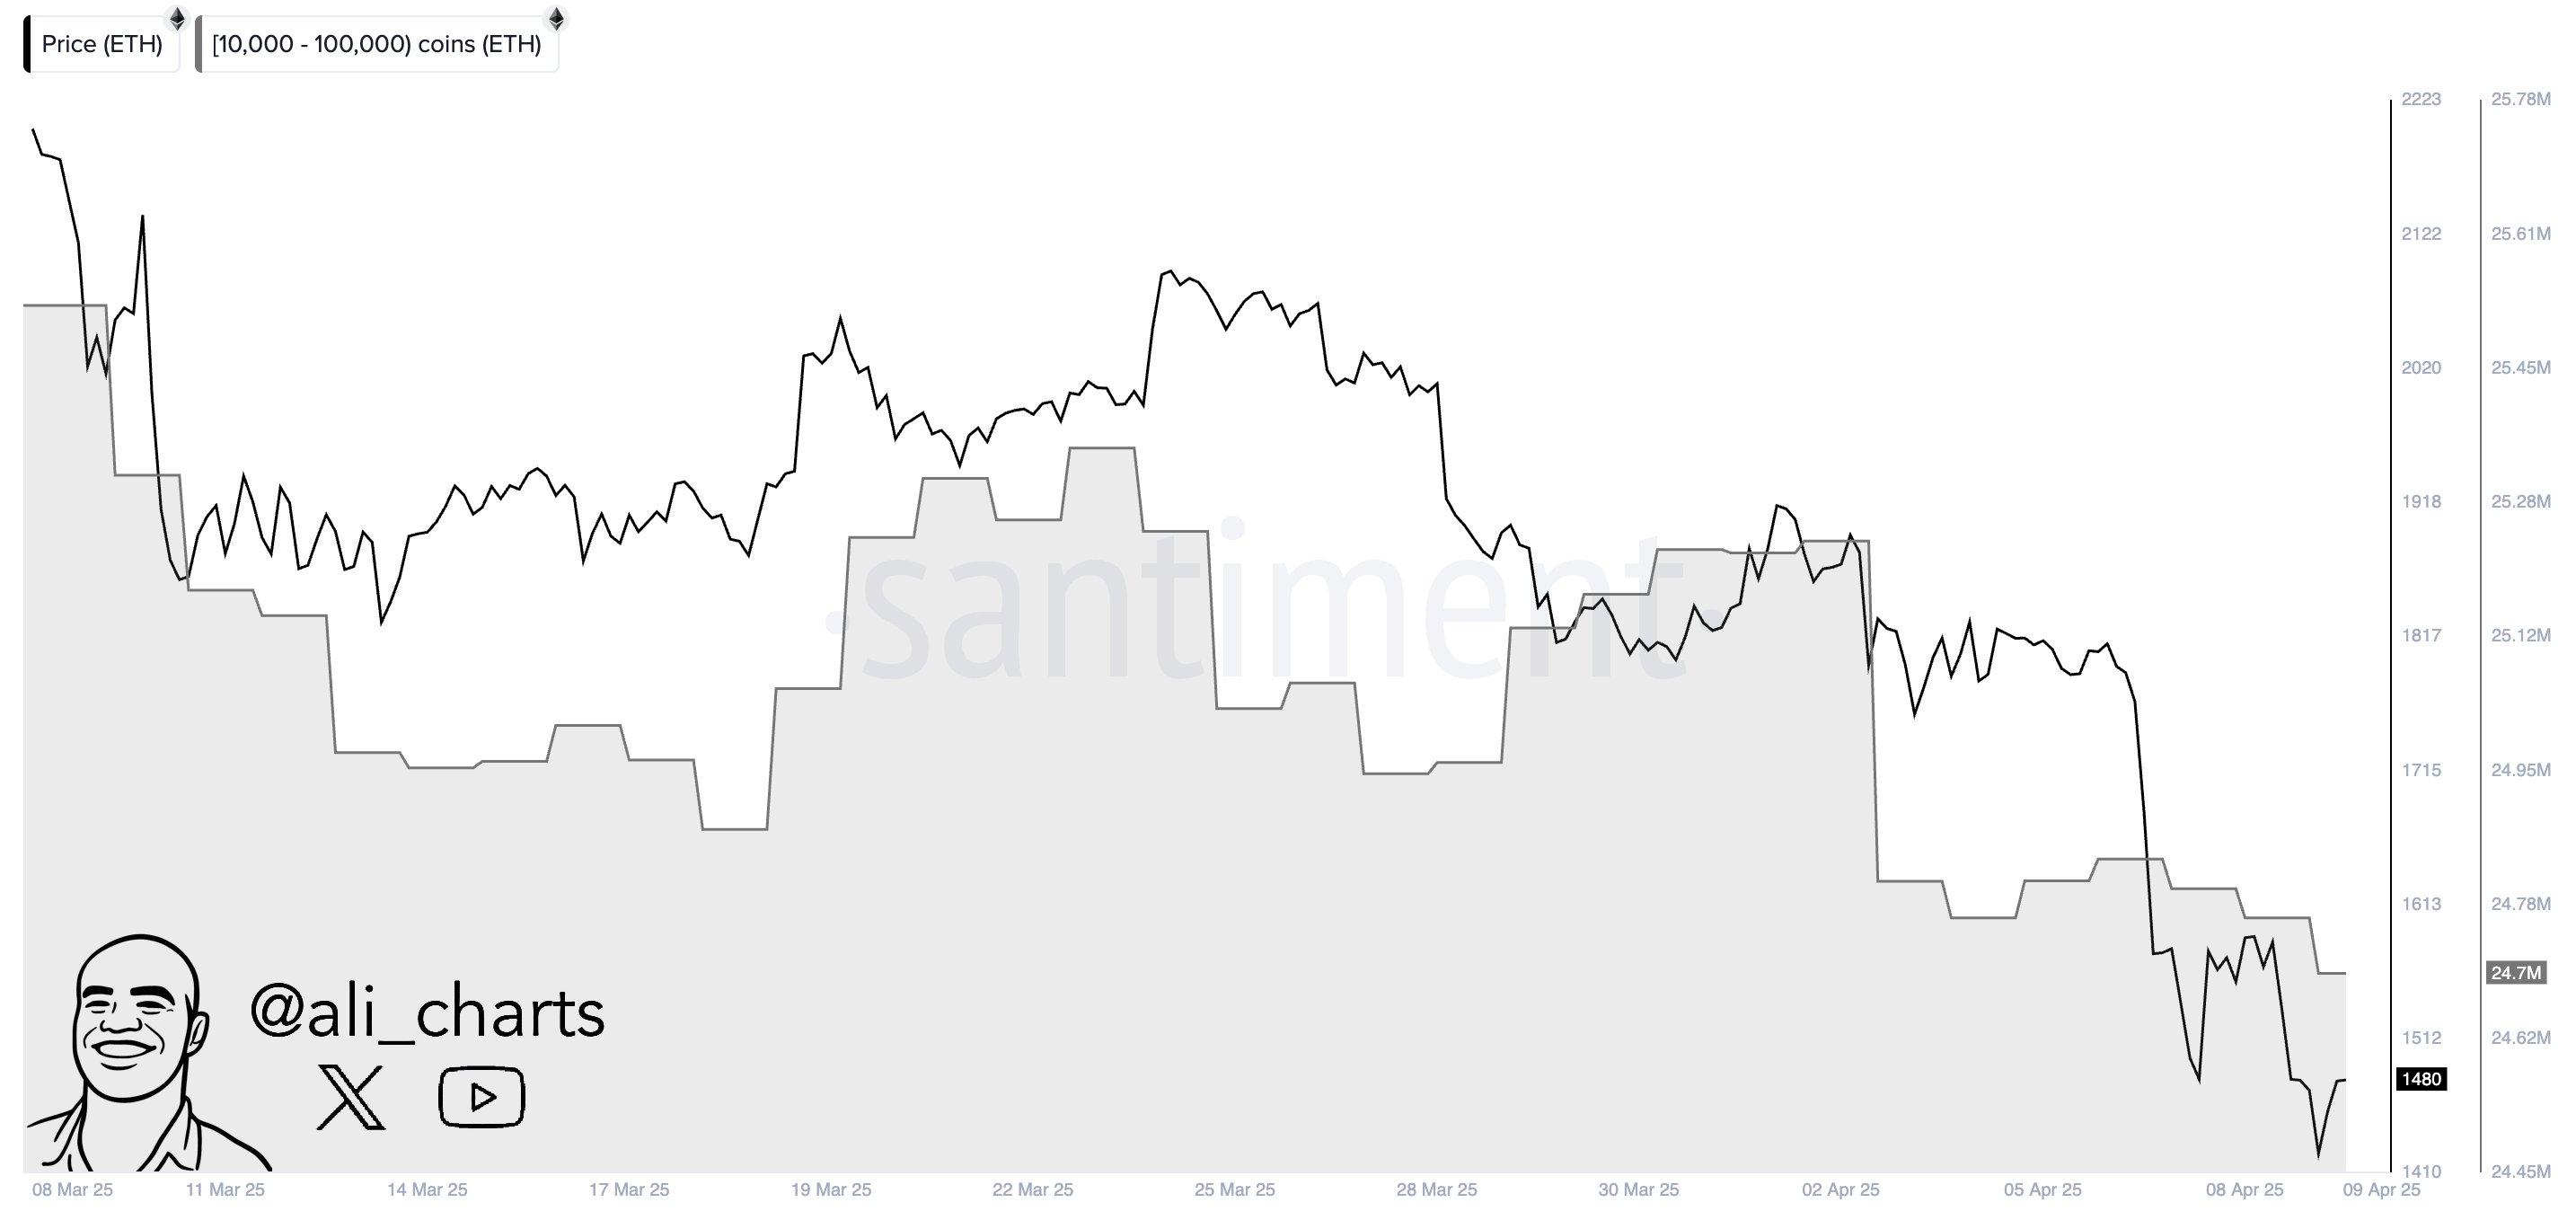
Large holders appear to be repositioning amid the drawdown. On-chain tracker Ali Martinez said whales moved over 530,000 ETH in the past week, potentially signaling distribution or reallocation.
Meanwhile, leveraged bearish positions have been the year’s top performers.
Bloomberg’s Eric Balchunas reported that ProShares’ UltraShort Ether ETF (ETHD) is the best-performing exchange-traded fund in 2025, up 247% year-to-date. Another inverse product, the T-Rex 2X Inverse Ether Daily ETF (ETQ), gained 219.2%.
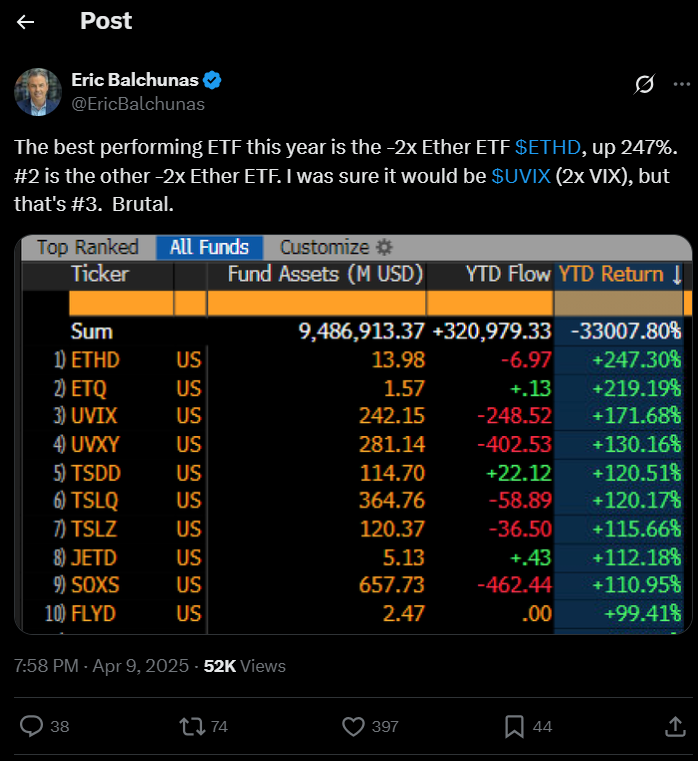
The performance of both products has outpaced even high-volatility vehicles like UVIX, a 2x VIX-linked ETF.
Layer-1 Rivals Outperform as Ethereum Activity Dips
Ethereum’s on-chain usage is also showing signs of stagnation. DappRadar data shows Ethereum’s unique active wallets interacting with decentralized applications (DApps) fell over 33% in the past 30 days.
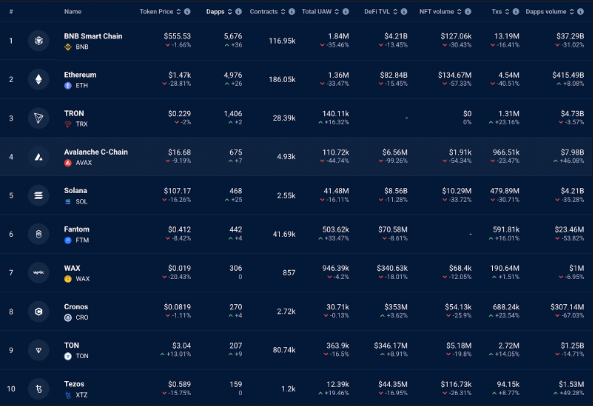
By contrast, Tron’s activity rose 16%, while Solana’s dropped just 16%.
The total number of Ethereum transactions also declined 40.5% during the same period. Other networks, including BNB Chain and Avalanche, showed smaller drops, while Tron and Fantom posted double-digit increases.
High gas fees on Ethereum continue to push users toward lower-cost alternatives.
Ethereum Price Outlook: $1,000 in Sight?
Long-term ETH holders appear to be capitulating. According to analyst Ali Martinez, “Long-term #Ethereum $ETH holders have entered ‘capitulation’ mode,” which may present a contrarian accumulation zone for some traders.
But with realized price lost, futures data bearish, and ETF flows declining, the market may test lower levels before any lasting recovery. ETH now faces a potential retest of the $1,000 region if the trend persists.
As of Apr. 9, Ethereum trades at $1,624, with key resistance near $1,800. Traders continue watching the $1,000–$1,200 zone for a possible bottom, as macro headwinds and on-chain stress test sentiment across the crypto sector.
Disclaimer
In this article, the views and opinions stated by the author or any people named are for informational purposes only, and they don’t establish the investment, financial, or any other advice. Trading or investing in cryptocurrency assets comes with a risk of financial loss.