no crying in the casino
 Pyth Network
 NEAR Protocol
 Starknet
 Quantus
 Pearl
Pearl Bitcoin
Key Insights:
- SOL breaks descending trendline, forms first higher high since Jan.
- Resistance near $155–$162 could determine next move.
- Whale outflows and ETF news add volatility to sentiment.
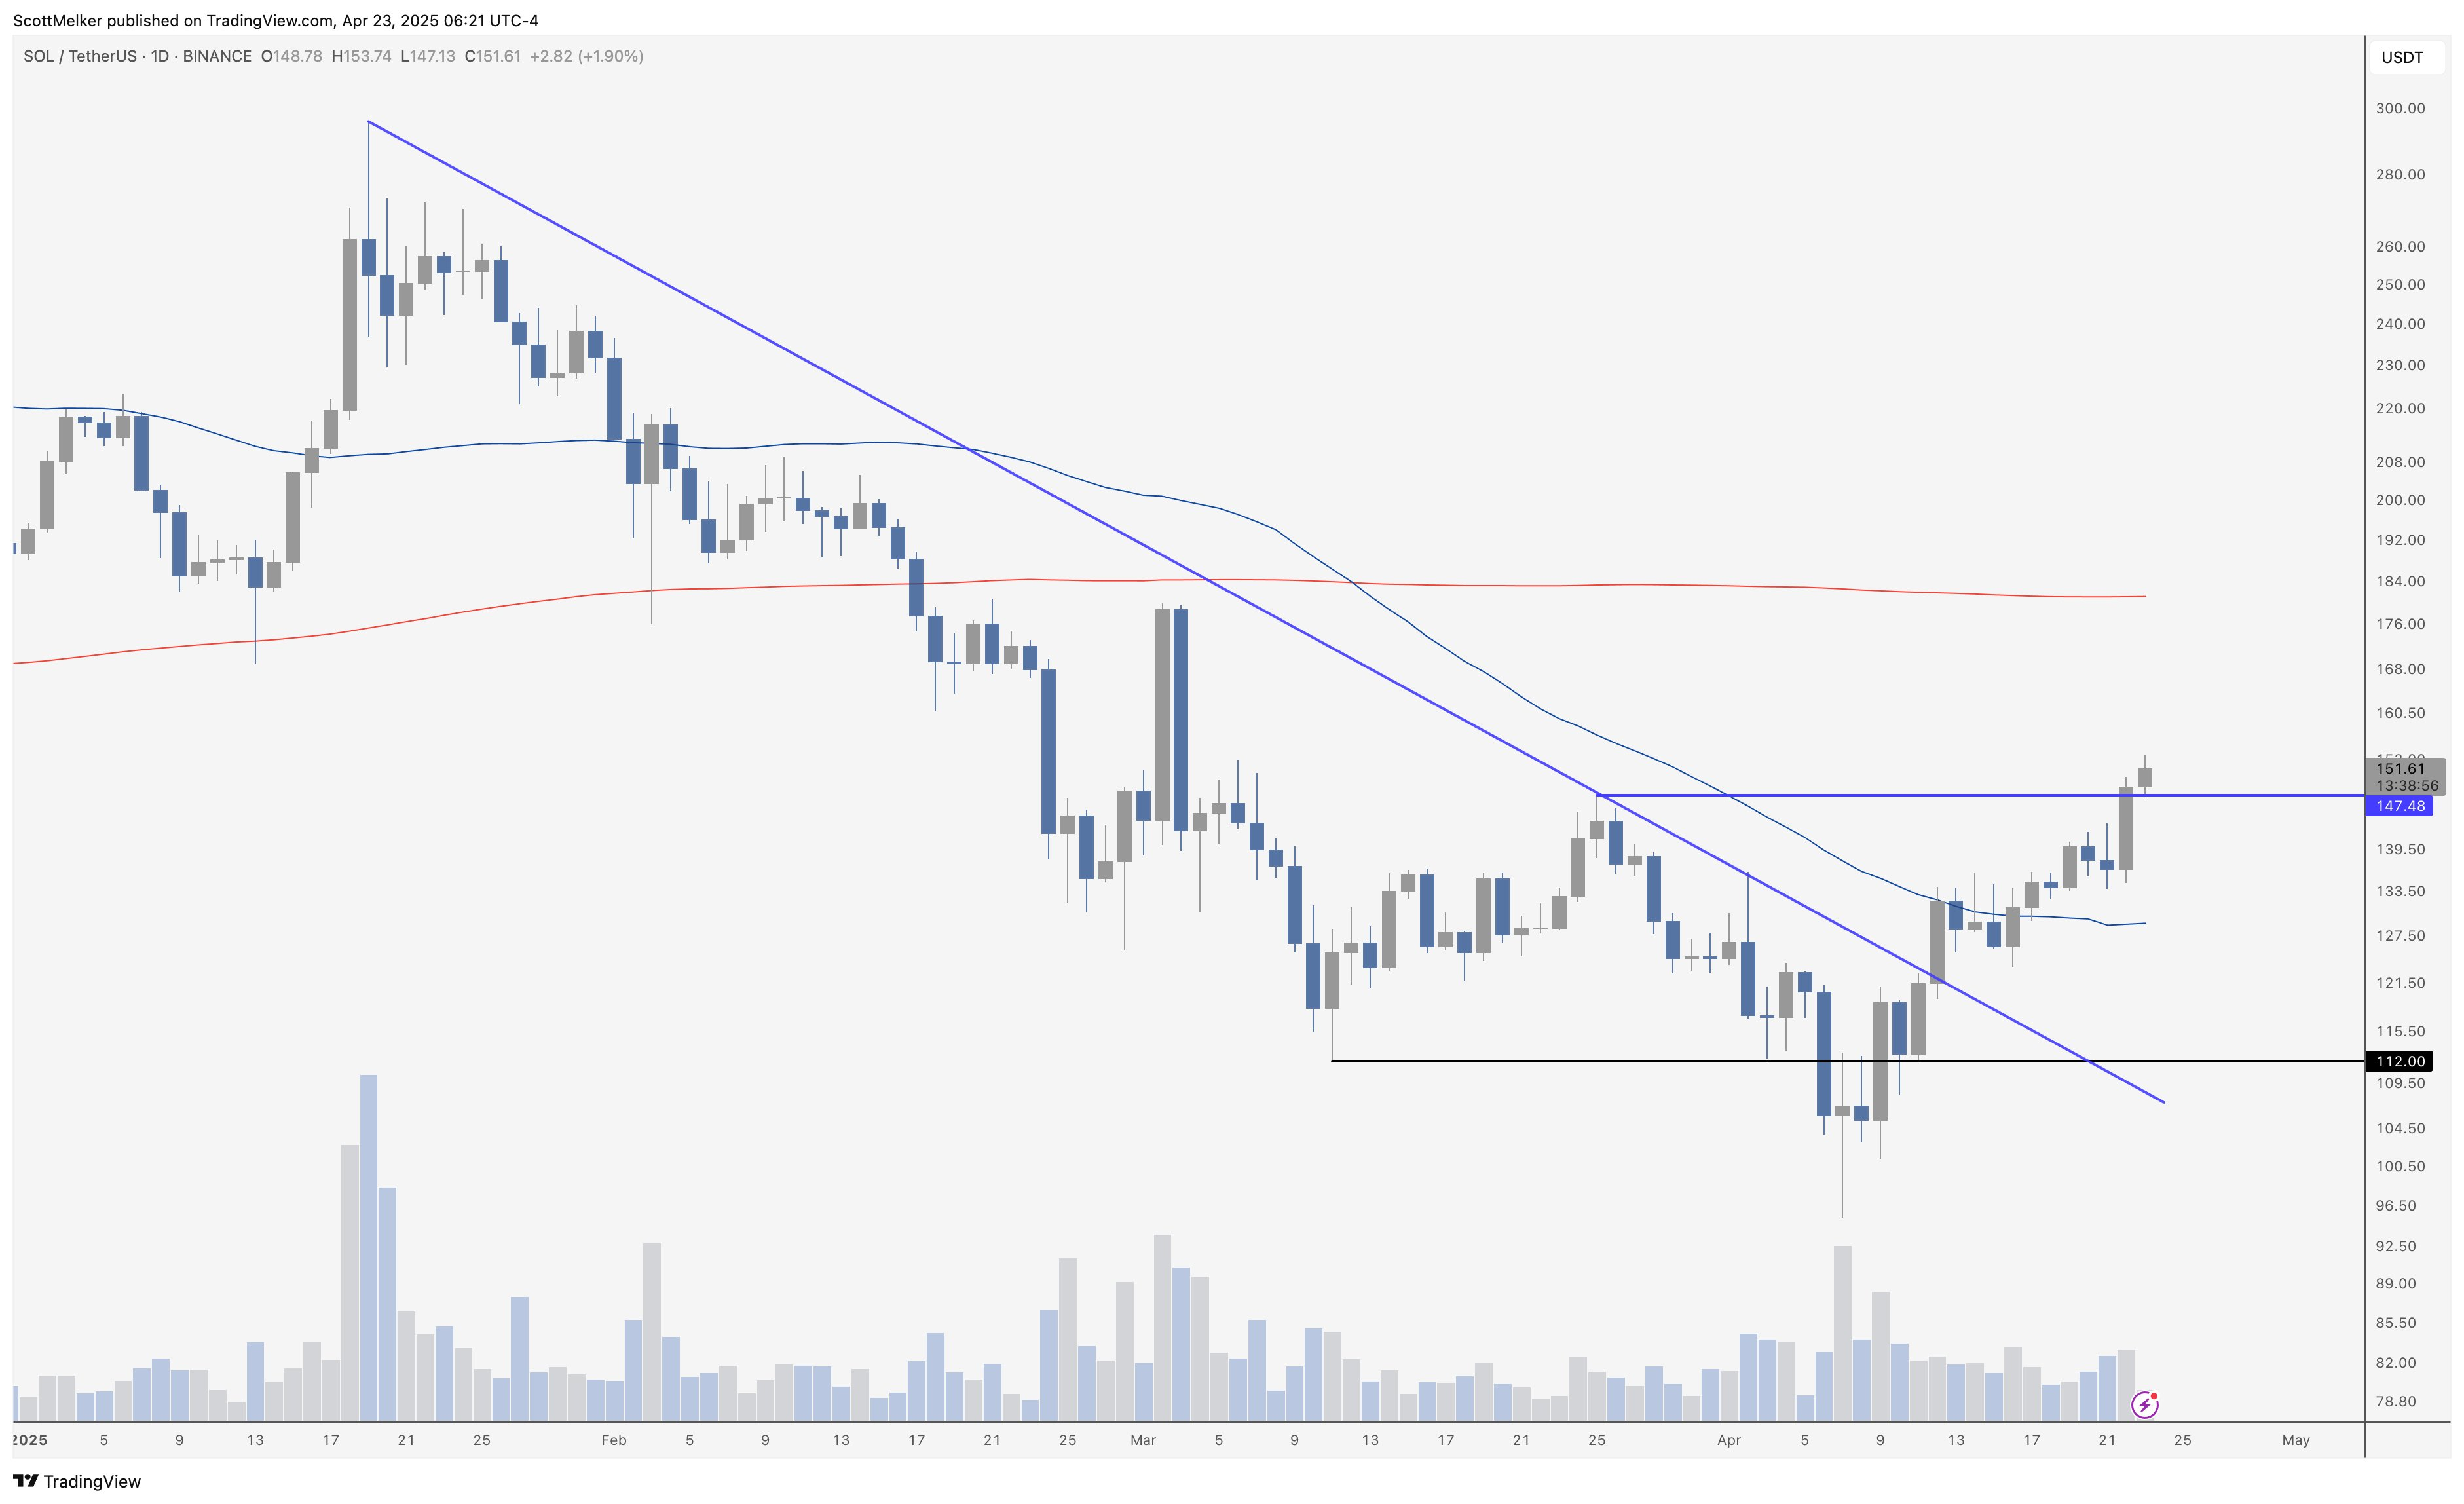
Solana (SOL) extended its rally on Apr. 24, pushing above the $148 mark after confirming a breakout from a multi-month descending trendline. The move marked its first higher high since January, a shift noted by trader Scott Melker who said the “bearish trend is officially broken.”
Solana Price Hits Critical Resistance Zone as Traders Eye $160
SOL has risen over 40% from its local lows, reaching levels last seen in early March. This recovery coincides with rising open interest and increased short liquidations, suggesting a market shift toward bullish momentum.
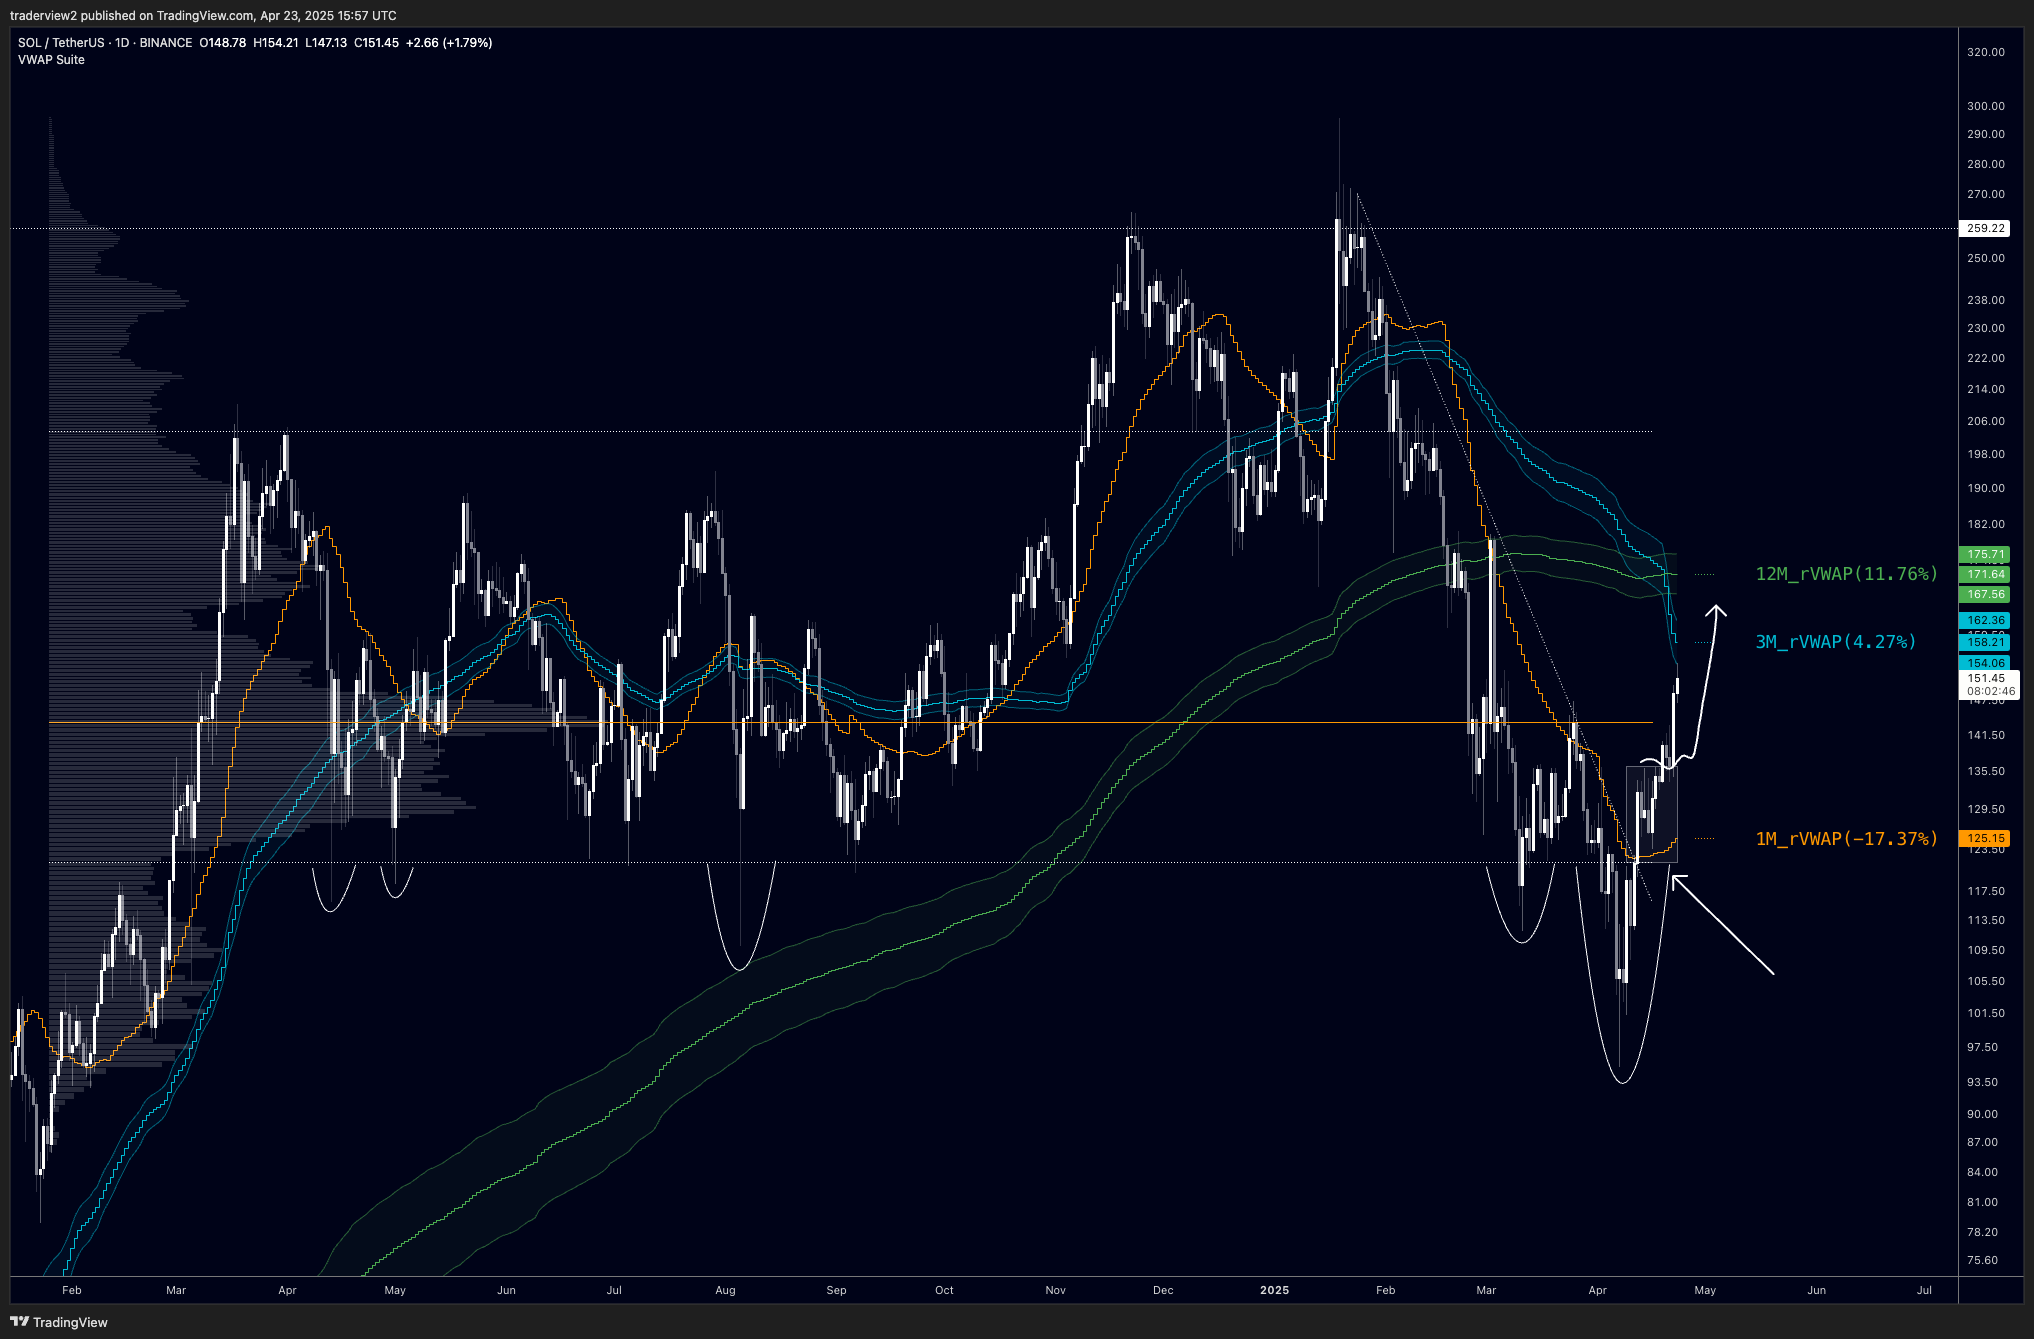
Dom highlighted the token’s 20% rise since his trade setup. He said SOL now trades near his “area of interest in the $160s,” flagging potential resistance ahead.
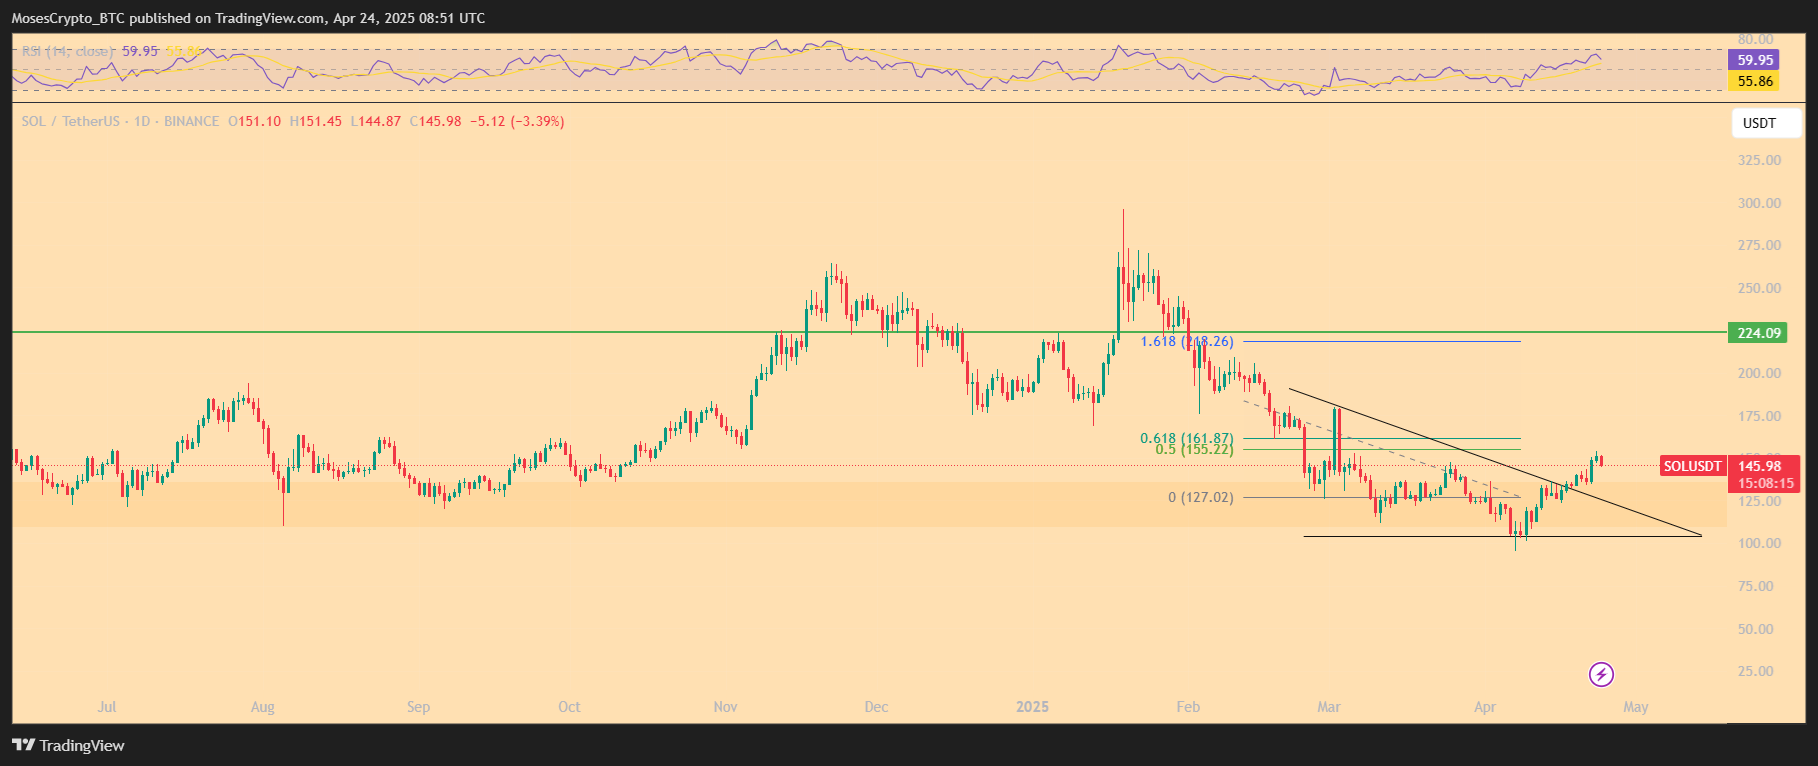
According to a TradingView chart, Sol price broke above its descending trendline and tested the $155 zone—the 0.5 Fibonacci retracement level from its Feb. peak. The 0.618 level at $161.87 remains the next key resistance. RSI sits near 62, showing bullish momentum but nearing overbought territory.
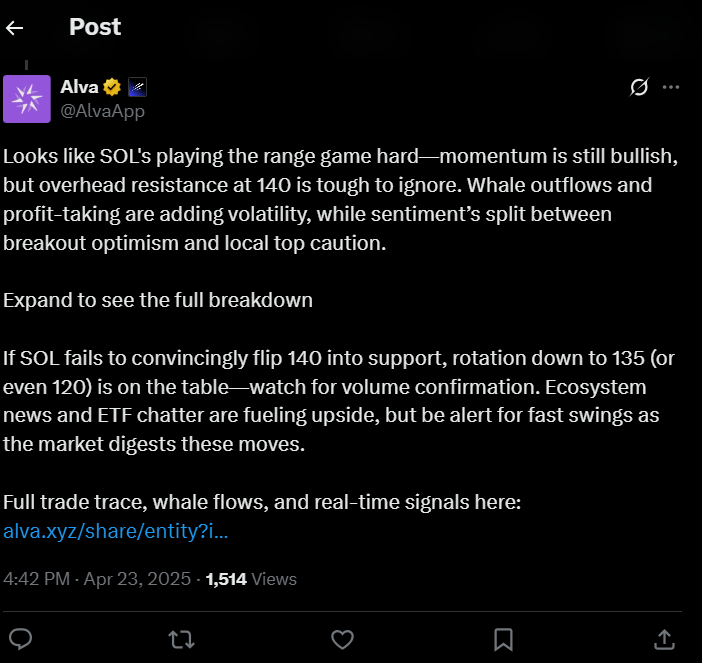
AlvaApp analysts emphasized that “overhead resistance at 140 is tough to ignore” and pointed to profit-taking and whale outflows as volatility triggers. They added that if SOL fails to hold above $140, “a rotation down to 135 or even 120 is on the table.”
Traders Debate Range Breakout or Local Top
Scott Melker noted that SOL made its first higher high since the January downtrend began. “Bearish trend is officially broken,” he posted on Apr. 23. This echoes technical confirmation that Solana flipped its descending structure.
Meanwhile, trader XO warned that current price action remains within a broader range. “Let the liquidity games continue,” he wrote, referring to shorts being squeezed out as SOL approached $150. He added that this level is “the first decent level of resistance” and cautioned about a possible local top forming.
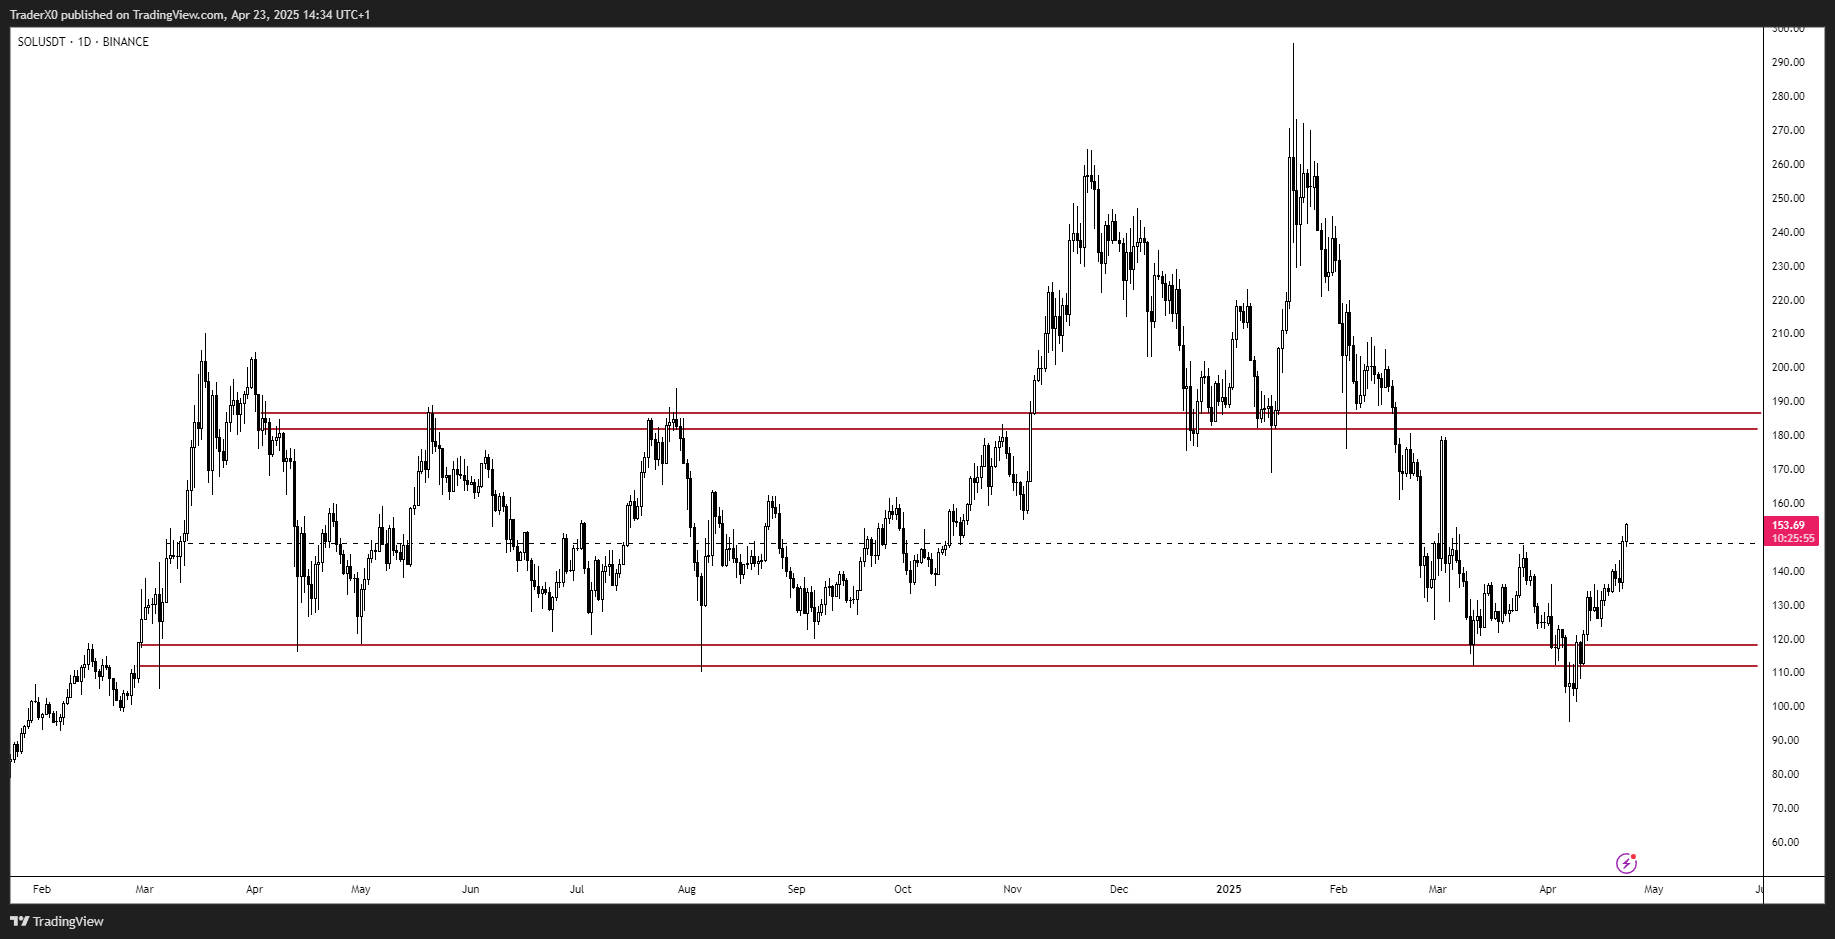
XO previously highlighted $120s as a key support zone. That area held during multiple retests earlier in April, providing a base for the current breakout. Still, XO added, “wouldn’t be surprised to see the low 90s traded” if the move fails to hold.
Momentum Builds Despite Divided Sentiment
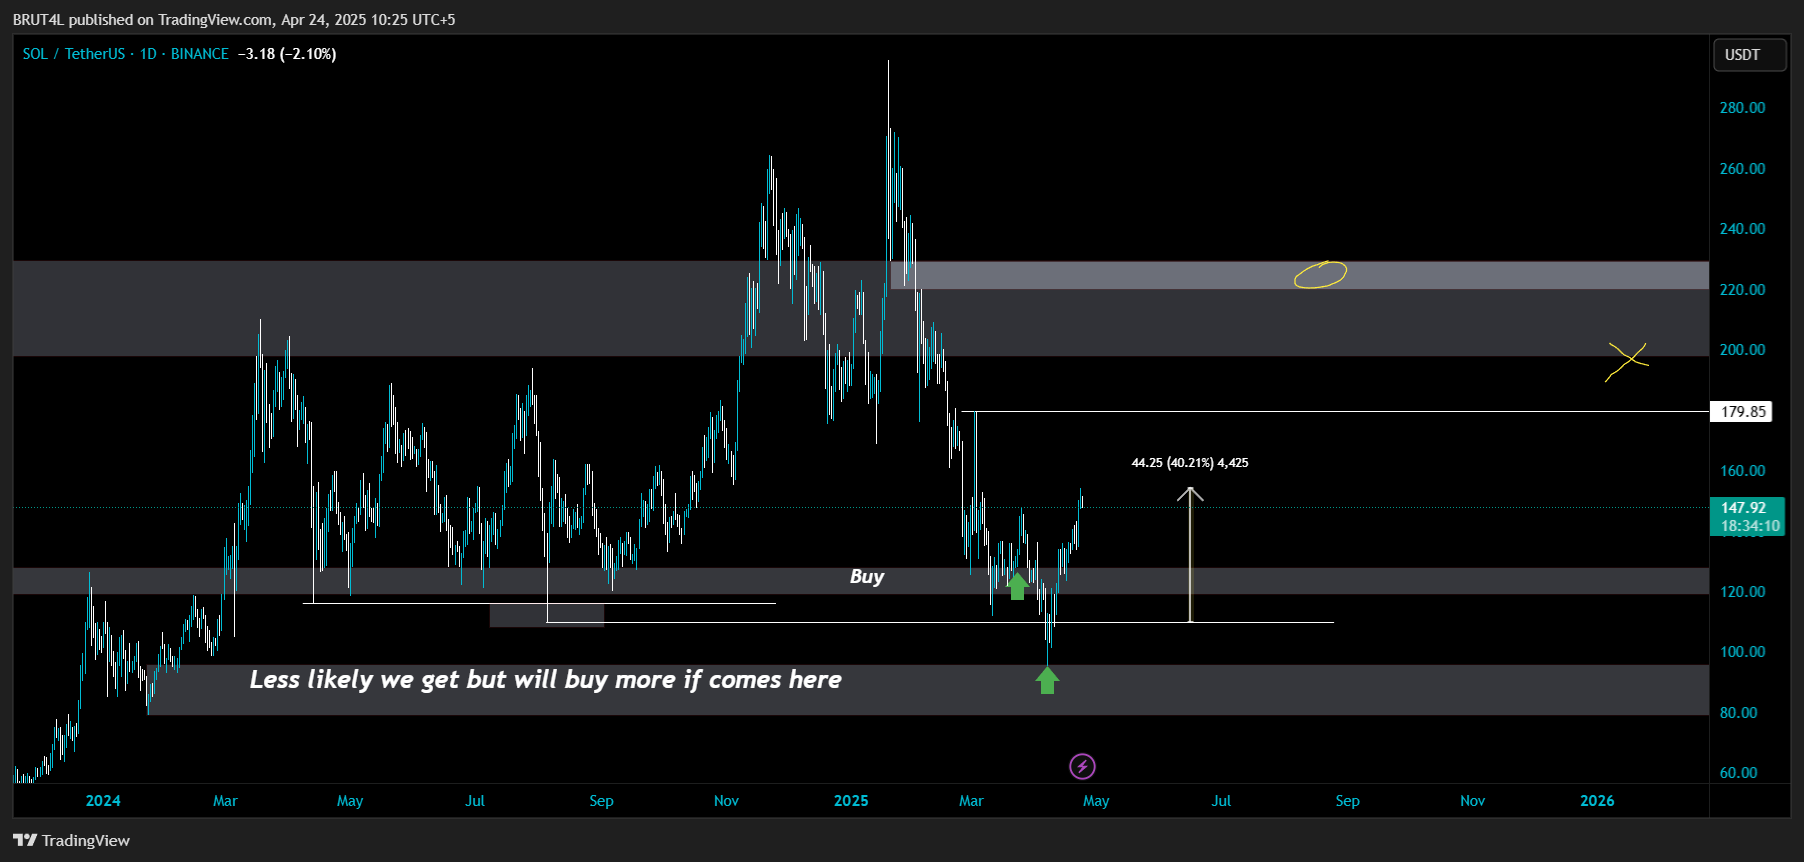
Sentiment remains mixed. Some traders, including Brutal BTC, reported solid profits. The trader said he is “40% up from average buys” and confirmed a recent low entry as “executed to perfection.”
Others remain cautious, citing whale behavior and ETF news as double-edged drivers. AlvaApp’s breakdown noted that while upside momentum is visible, volume confirmation is still needed to solidify the breakout.
On-chain data shows Solana price action has repeatedly respected Fibonacci levels since its yearly high near $210. A clean flip of $155–162 resistance could trigger momentum toward the $180 and $200 regions. Failure to clear the zone could open downside risk back toward $127 support.
Bulls Need Volume to Confirm Breakout
Technical structure favors the bulls, but a breakout without strong volume could falter. SOL must flip $155–162 into confirmed support for continuation. Otherwise, bears may attempt to trap longs near local tops.
“Make plans > wait for triggers > execute to perfection,” BrutalBTC advised, summarizing current trader behavior.
SOL traded at $148.45 at the time of writing, down 1.75% on the day but still well above April lows. Market participants remain focused on key resistance levels as ecosystem developments and ETF discussions continue to impact price.
Disclaimer
In this article, the views, and opinions stated by the author, or any people named are for informational purposes only, and they don’t establish the investment, financial, or any other advice. Trading or investing in cryptocurrency assets comes with a risk of financial loss.