Bitway
 Pearl
Pearl Zylo Ecosystem
 Walrus
 Derive
 Pudgy Penguins
 Arbitrum

Key Insights:
- $2.3B ETF Inflows Pump Bitcoin price to over $94,000.
- BTC price breaks falling wedge and 200-day SMA, eyeing previous all-time high.
- Low whale activity threatens the BTC rally strength.
Bitcoin price has been on a wild ride. As of April 25, 2025, the king of crypto is sitting at $93,125.68, up 0.4% in the last 24 hours as of 1:01 a.m. EST. While a good value increase is welcome, experts think this price action isn’t coming from the usual suspects. They are pointing fingers at ETF flows and open interest (OI) as the main drivers behind BTC’s recent pump, while on-chain activity remains quiet.
Bitcoin Price Rises on ETF Flows and OI
Social sentiment around the crypto X community reveals Bitcoin’s latest price surge isn’t about the holders moving coins on-chain. It’s the big investors playing with ETFs and futures that are juicing this rally.
Crypto analyst Maartunn said the “Bitcoin network is a ghost town”, noting that there has hardly been any new visible on-chain demand on the network. According to Maartunn, the current BTC price surge is all ETF flows and OI, not on-chain activity.
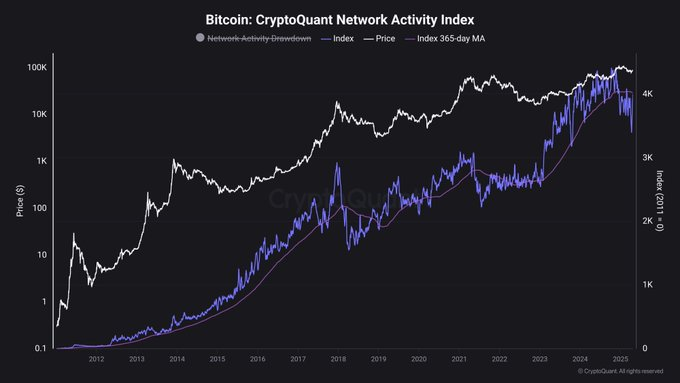
This means Institutional money is flooding into Bitcoin ETFs, and traders are stacking leveraged bets in the futures market, pushing prices up faster.
This is especially true as President of ETF Store, Nate Geraci, noted that over $2.3 billion flowed into spot BTC ETFs over the past 4 days. IBIT led the pack with a 7-day inflow streak, and as a result, BTC price coincidentally rose with the inflow, topping out at $94,641 before entering a short consolidation.
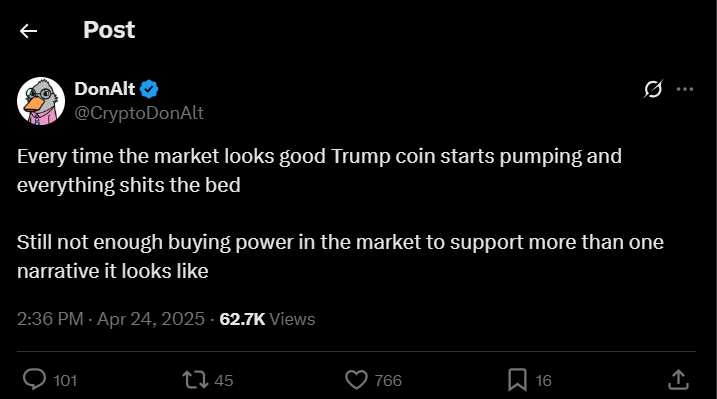
Meanwhile, analyst DonAlt thinks the crypto market is not matured enough to “support more than one narrative” since as soon as Trump coin started pumping, altcoins began to bleed, repeating what happened during the inauguration week, when the newly launched Trump-backed coined drained most of the liquidity from the rest of the market.
But here’s the kicker: while the price is popping, on-chain activity—think wallet transactions, coin movements, etc—isn’t showing the same energy. IntoTheBlock data on large holder inflows (1,000+ BTC) shows a noticeable dip in activity.
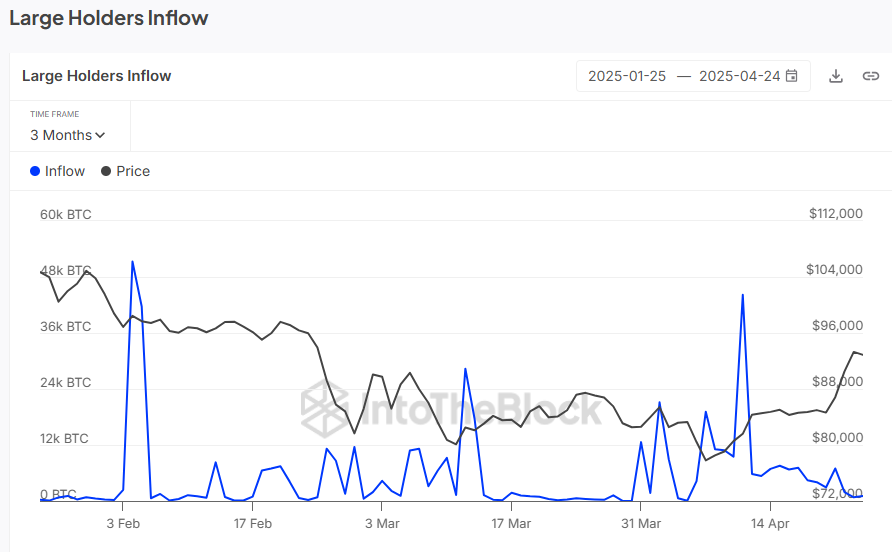
Whales aren’t accumulating like they used to during past bull runs, which raises some eyebrows. If they are not buying, who’s driving this party?
Bitcoin Price Analysis: Falling Wedge Breakout or Fakeout?
The BTCUSD chart on the daily timeframe shows that the asset recently broke out of a falling wedge, hitting a new local high of $94,641. The breakout was strong, and price flipped the 200-day simple moving avg. (SMA), which previously acted as a dynamic resistance for the last 44 days.
At the current price of $93,125, BTC has pulled back 0.67% from the local high. This breakout was also marked by a rise in volume, which gave it some credibility. But here’s where it gets juicy: the relative strength index (RSI) is at 65.84, flirting with overbought territory, and the moving average convergence/divergence (MACD) indicator is showing a bullish crossover with the histogram ticking up. These indicators signal “bullish momentum,” but the lack of on-chain activity casts doubt on whether this pump has legs.
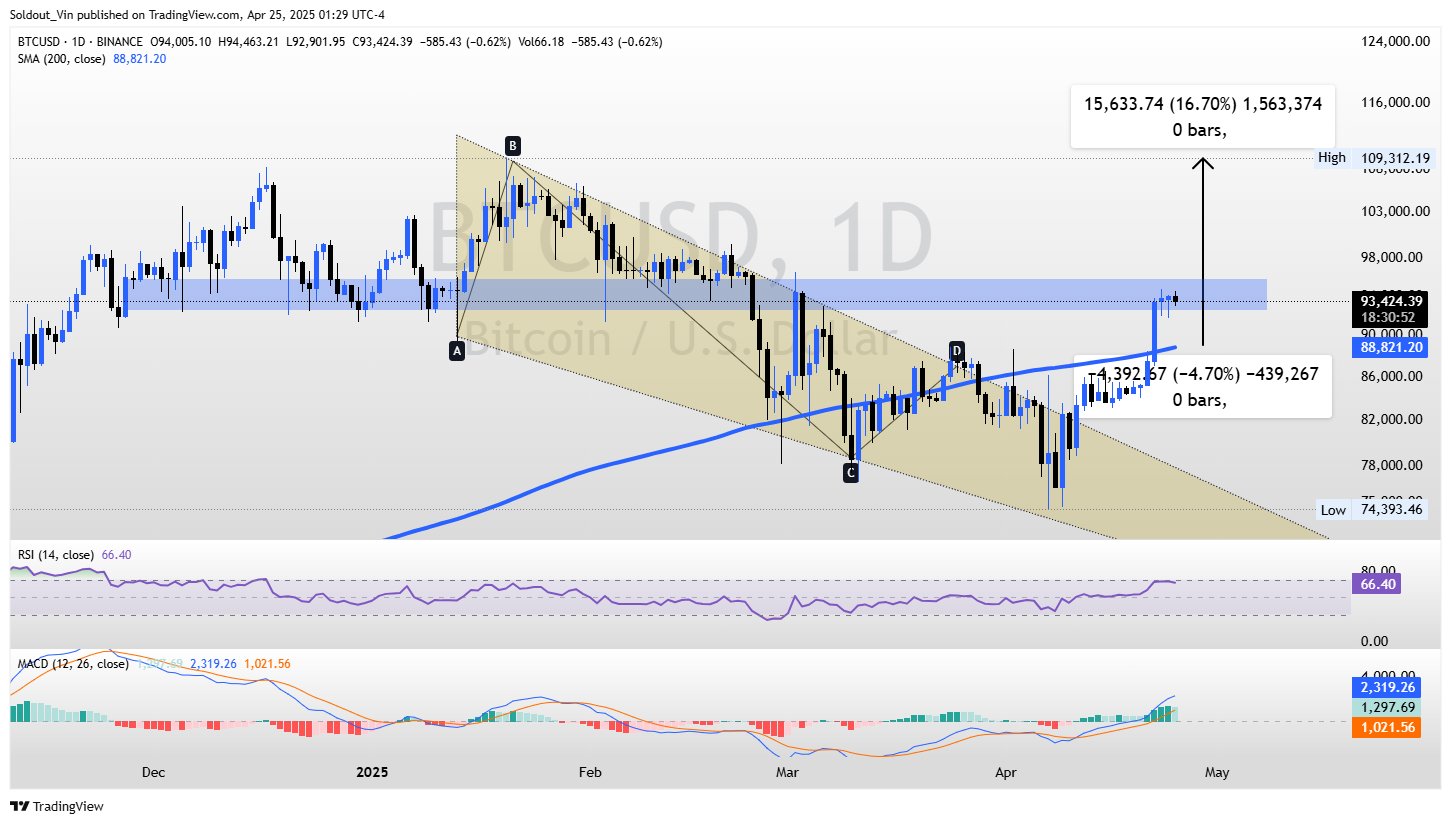
If BTC holds above the current $94,000 resistance level, it may surge higher in the next couple of weeks and hit its previous all-time high price.
But if on-chain activity doesn’t pick up, this breakout could turn into a fakeout, and we might see BTC test $88,820 (200-day SMA) and potentially fall lower to $82,495 support again. Worse, BTC could correct deeper to the yearly low level of $74,393.
Bitcoin is soaring on ETF inflows and rising open interest (OI), but weak on-chain activity is a red flag. Technicals still point bullish, with RSI and MACD supporting the trend. However, if whale movement and on-chain metrics don’t pick up, the rally might lose steam.
Disclaimer
In this article, the views and opinions stated by the author or any people named are for informational purposes only, and they don’t establish the investment, financial, or any other advice. Trading or investing in cryptocurrency assets comes with a risk of financial loss.