
 streamoors
 Sword Inu
 Altai the Tiger
 IGNITION
 no crying in the casino
 NEAR Protocol
 Pudgy Penguins

Key Insights:
- Cardano’s price pattern formed an ascending triangle, signaling a bullish breakout to $2.70–$2.91.
- ADA long-term holders increased by 1.81%, with holding time up 77.53% in 7 days, indicating rising investor confidence.
- The 50-day SMA is nearing a cross above the 200-day SMA, signaling a potential Golden Cross and bullish trend formation.
Cardano (ADA) price has drawn attention from analysts and investors following recent technical developments. Multiple indicators suggest a potential upward price movement for ADA.
Analysts point to chart patterns, increased long-term holding activity, and technical formations that may support a rally. With the price currently above $0.70, the key question is whether Cardano can break above $2 soon.
Forecasts from experienced market observers indicate that ADA could experience a surge of over 260%. If realized, the altcoin’s value would range between $2.70 and $2.91. Several technical and behavioral metrics are aligning to support this Cardano price prediction.
Cardano Price Gearing Up for a 260% Rally To $2.70
According to crypto analyst Javon Marks, Cardano is forming an ascending triangle on the chart. This pattern often indicates a continuation of an upward trend. It typically forms when a flat resistance line is matched with rising lows. The pattern suggests strong buying activity at increasingly higher prices.
Additionally, Marks points out that a breakout above the resistance level could trigger a large price increase. Historical data shows that a similar setup previously resulted in a 300% rise. The current formation supports the possibility of a comparable move if the pattern plays out similarly.
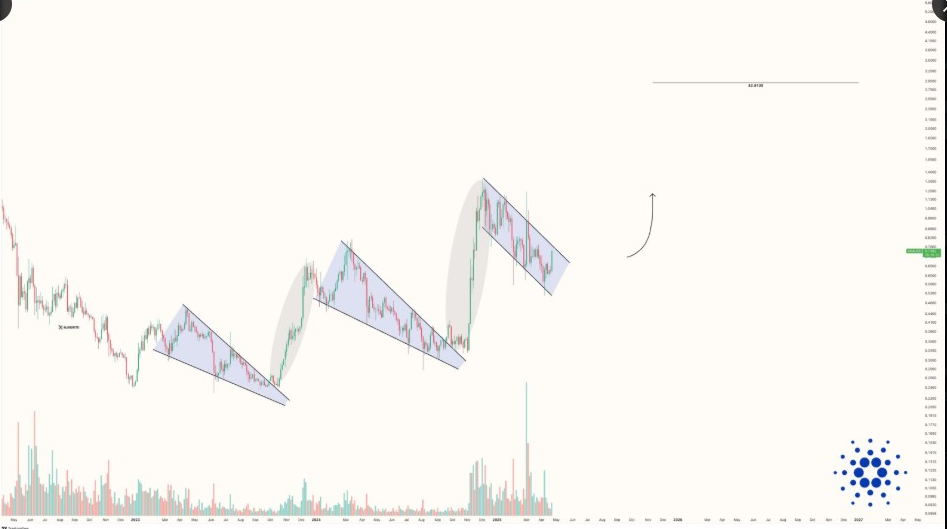
The top altcoin price has also recorded a 3% gain in the last 24 hours, reflecting ongoing accumulation. Repeated testing of the triangle’s resistance may imply readiness for a breakout. Marks sets ADA’s target range at $2.70 to $2.91 based on these observations.
Long-Term Holder Behavior Shows Growing Support for ADA
The number of Cardano holders retaining the asset for more than one year has grown by 1.81%. This increase signals that investors are opting to hold ADA rather than sell or trade in the short term. According to data from IntoTheBlock, the average holding time also jumped by 77.53% over the past seven days.
Medium-term holders, or “Cruisers,” also showed a 7.65% increase. These trends indicate investor trust in ADA future, especially in anticipation of a potential bullish phase. Long-term holders are often viewed as foundational to cryptocurrency’s market stability.
The shift in ownership patterns comes at a time when other bullish indicators are developing.
Technical Indicators Signal Bullish Momentum for Cardano
Moreover, analysis shows that the 50-day Simple Moving Average (SMA) is about to cross and exceed the 200-day SMA. Most times, the technical formation of a Golden Cross indicates a bullish trend.
Open interest in ADA’s derivatives market has reached $874.52 million, reflecting a 13.76% increase. This shows heightened activity and suggests traders are positioning for a potential price movement. Elevated open interest often accompanies larger price shifts.
The Relative Strength Index (RSI) currently stands at 65. This places it in the near overbought range. However, in an upward trend, RSI can remain elevated as buying pressure continues. More so, the RSI’s current direction points toward sustained momentum.
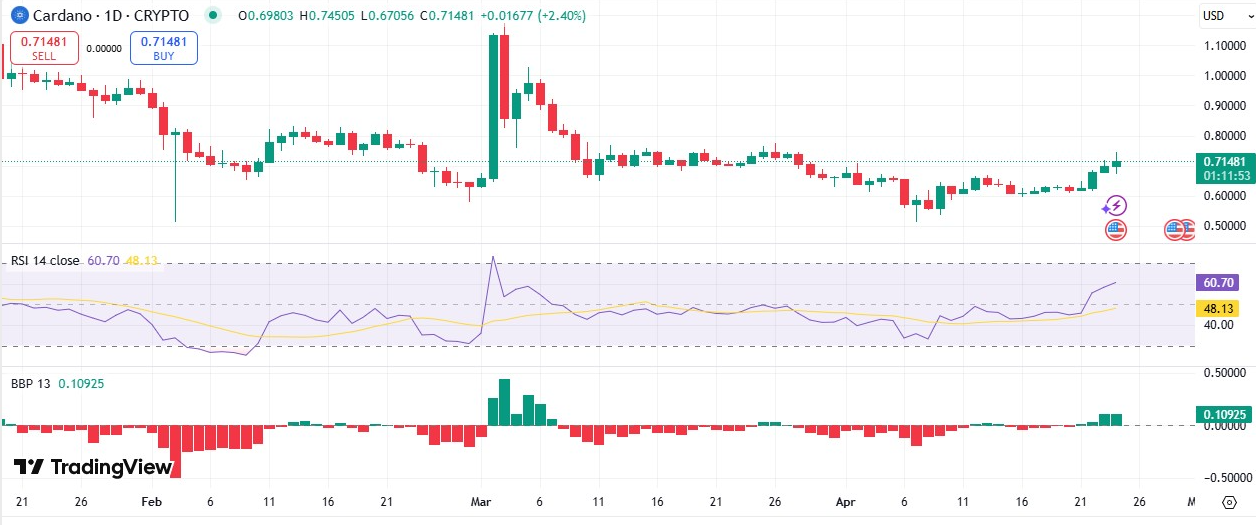
Meanwhile, the Bull Bear Power (BBP) indicator shows a positive value of 0.10899, supporting the bullish Cardano price prediction. This reflects growing buying momentum, in line with ADA’s recent upward price movement.
Recent Chart Breakout Adds Fuel to Cardano’s Bullish Setup
A separate technical analysis from analyst Justin Wu identified a breakout from a descending wedge pattern. This type of breakout is often seen as bullish. ADA held its support zone before moving above the wedge resistance. This price action may signal an end to downward pressure.
Analyst Wu highlighted two near-term targets following the breakout. The first is $1.2456, while the second is $1.4642. These levels were derived from the chart’s resistance and support structure.
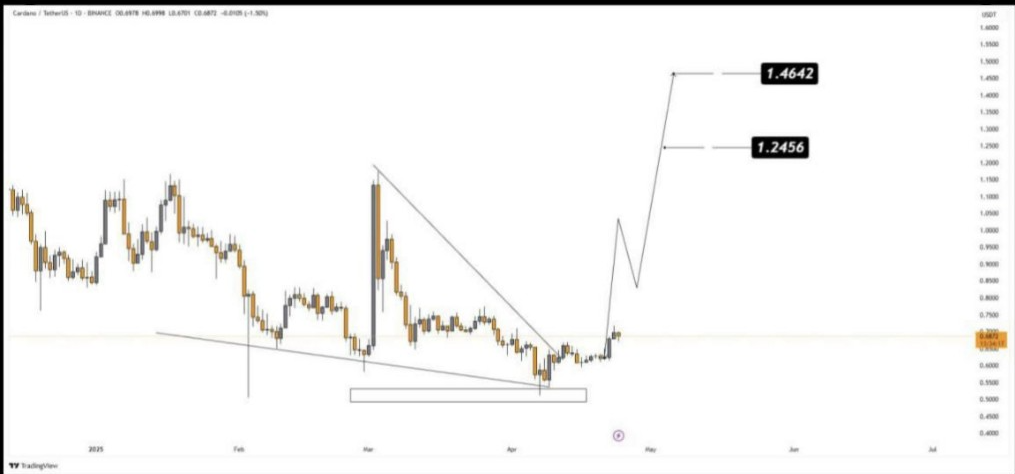
Volume has also increased as the breakout occurred. This can be a confirmation signal when paired with technical patterns. A reaccumulation pattern above the previous support zone adds strength to the breakout case.
If current trends continue, Cardano price may approach the $2 level. The next phase of the market will be crucial in determining whether ADA sustains this momentum and reaches the breakout targets.
Disclaimer
In this article, the views and opinions stated by the author or any people named are for informational purposes only, and they don’t establish the investment, financial, or any other advice. Trading or investing in cryptocurrency assets comes with a risk of financial loss.




