Bitcoin
 Starknet
 Pearl
Pearl ZKsync
 NEAR Protocol
 Quantus
 Zerebro

Key Insights:
- Solana price closed in April above $135, with key support and a bullish structure on the monthly chart.
- A bull flag on lower timeframes signals a potential breakout above $150.
- Fair Value Gap support near $143 reinforces short-term bullish outlook for SOL.
Solana price continues to hold strong technical positioning after closing April above significant support. Analysts see the current setup as a foundation for potential breakout targets between $170 and $230.
Multiple bullish signals across different timeframes indicate strong buying momentum for SOL. This suggests that buyers are dominating the market as mid-May approaches.
Solana Price Action: Strong Support and Resistance Levels
CryptoBullet reported that the Solana price held a key horizontal support zone between $127 and $135 on the monthly chart. This successful defense signals strong buyer interest in maintaining price stability.
This level, which previously acted as resistance, has now flipped into support. The analyst noted that April’s monthly candle closed decisively above this zone, confirming its structural importance.
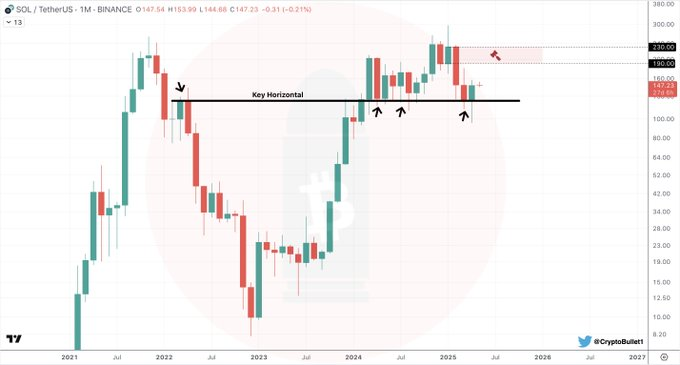
This horizontal range has provided a foundation for price action throughout 2024. The analyst identified the $190 to $230 range as a major resistance zone. This area was a key rejection point in the last market cycle.
If SOL consolidates above current levels, the chart suggests it may retest that upper range in the coming weeks. At press time, Solana price traded near $147, up nearly 30% from its March low.
The token remains well above its long-term moving averages, signaling ongoing trend strength as long as the horizontal support holds.
Daily Fair Value Gap Offers Rebound Zone
Analyst CryptoMillionYT emphasized Solana’s reaction to a fair value gap (FVG) on the daily chart. SOL price recently dipped into the $143 to $146 FVG zone before bouncing higher. According to the analyst, this area marks an imbalance in market structure and often attracts liquidity.
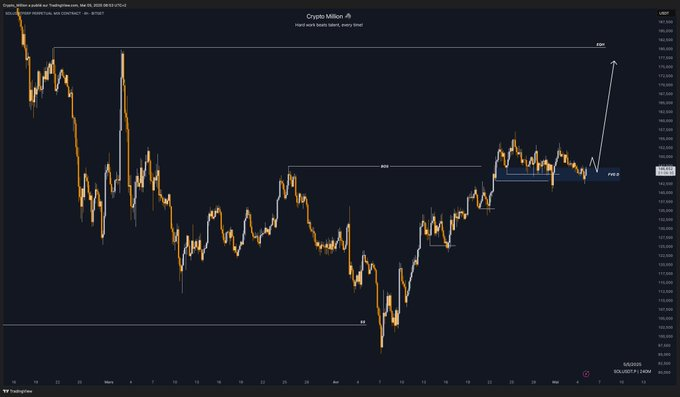
He stated that for the bullish outlook to remain valid, the Solana price must stay above this daily FVG zone. A close below the $143 base would invalidate the current bullish structure. However, if support holds, the price could push toward $160 and $170 soon.
This analysis aligns with recent price trends where SOL price responded to similar gaps with sharp upward movement. Such a reaction zone within an uptrend suggests buyers remain active at key levels.
Bull Flag Pattern Points to Potential Breakout
Crypto analyst Hardy observed a forming bull flag pattern on Solana’s 4-hour chart. This pattern often signals potential continuation of the upward trend.
The structure formed after a sharp move from the $125 level to recent highs, followed by a tight descending channel. This pattern is typically a continuation formation and often resolves with an upward breakout.
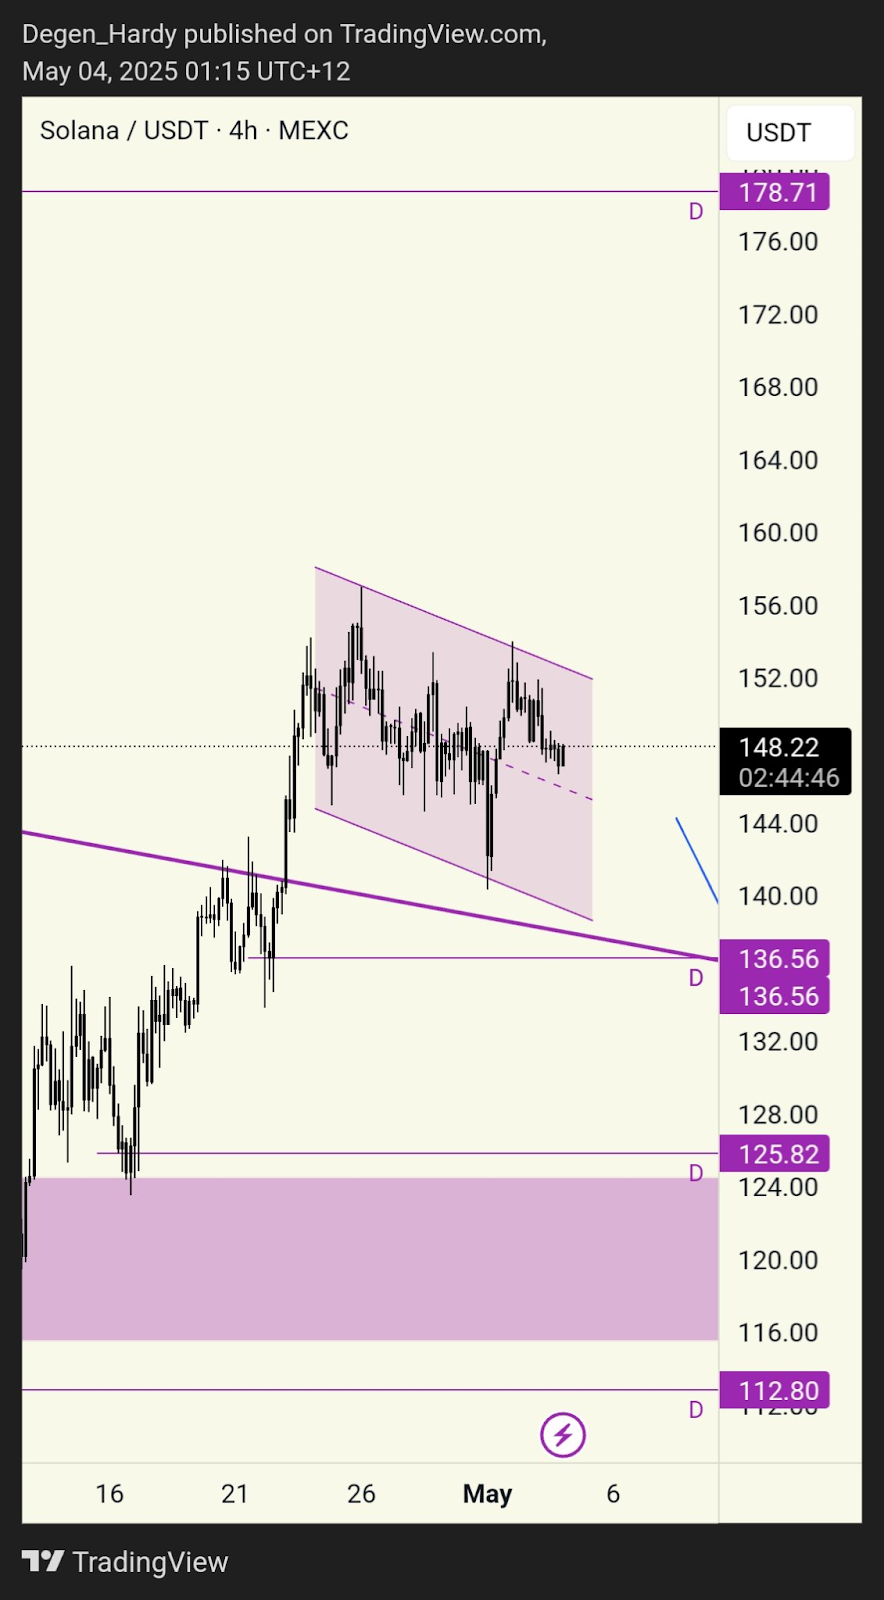
According to Hardy, the flag’s upper resistance lies near $152, while support is aligned with the broader $136 level. If the SOL price breaks above the flag with increased volume, it may quickly revisit the $170 area.
Solana Price Outlook: Strong Support and Potential Upside
Solana price has formed a series of higher lows on the hourly, daily, and weekly time frames. Despite the pullback, the token trades above the 50-day moving average, as it’s still in a broader uptrend.
The daily chart has neutral RSI levels, suggesting there is still more upside before going overbought. The trading volume has increased around the essential support zones, i.e., the Bears are accumulating.
Additionally, weekly candles close above ascending trendlines, solidifying a bullish conviction amongst longer-term traders. The $127–$135 support zone has been confirmed, and price action is above daily FVG support.
This suggests that momentum is leaning in favor of buyers. The alignment of the bull flag, fair value zone, and monthly structural base forms a strong technical confluence.
Ifthe SOL price breaks $152 resistance, the following upside targets will be $170 and the area $190 – $230. These are the following major test zones buyers should look out for to define the mid-term direction of the token.
Disclaimer
This article is for informational purposes only and provides no financial, investment, or other advice. The author or any people mentioned in this article are not responsible for any financial loss that may occur from investing in or trading. Please do your research before making any financial decisions.