
 Bitcoin
 Ondo
Ondo Pudgy Penguins
 Walrus
 Pons
Pons Quantus
 NEAR Protocol

Key Insights:
- Sui (SUI) hits $43.76B in 2025 DEX volume, topping Avalanche, Polygon, and Optimism.
- Market cap climbs from under $2B to over $10B in less than a year.
- $84M YTD inflows into SUI investment products exceed Solana’s $76M.
SUI is gaining traction as it approaches a key resistance at $5.40. The network is supported by $43.76 Billion in DEX trading volume and a growing $10 Billion market cap. With $84 Million in inflows, it continues to attract investor interest and position itself for further growth.
SUI Leads in 2025 DEX Volume Across Blockchains
The blockchain’s activity has also contributed to the success of SUI. Artemis reports that SUI’s DEX volume for the year so far, as of May 2025, is $43.76 Billion.
That total surpasses the combined figures of Avalanche, Polygon, and Optimism. Their respective amounts stand at $18.32 Billion, $12.31 Billion, and $10.37 Billion.
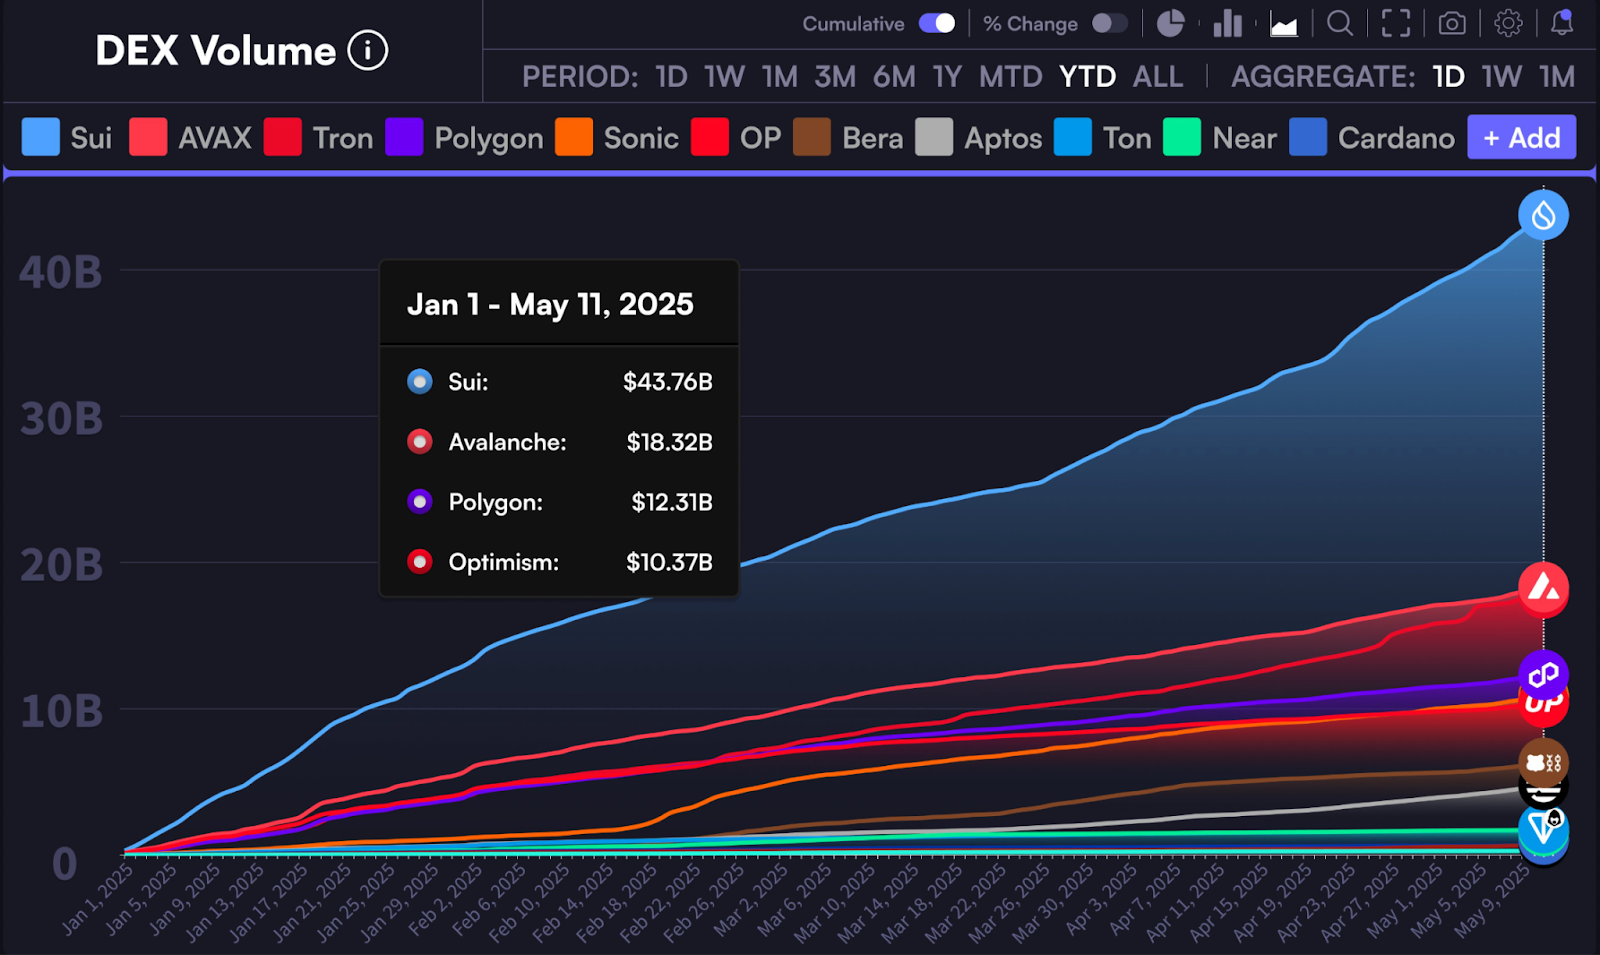
Since January 1, 2025, SUI has kept its DEX volume growing quickly and steadily. The growth means more people are using its ecosystem, which includes DeFi tools and token pairs traded on the network.
Liquidity on the platform is increasing, usually resulting in smoother trades and less slippage for users. SUI being ahead in DEX volume shows many users being involved. Large volumes on DEXs often indicate that traders, liquidity providers, and new protocols are more active.
Market Cap and On-Chain Data Support Growth Outlook
Moreover, DeFiLlama data reveals that SUI’s overall market cap and the network’s stablecoin activity have grown significantly.
The market cap of SUI went up from less than $2 Billion in mid-2024 to over $10 Billion by May 2025. This means SUI’s market cap grew by over 500% in less than a year.
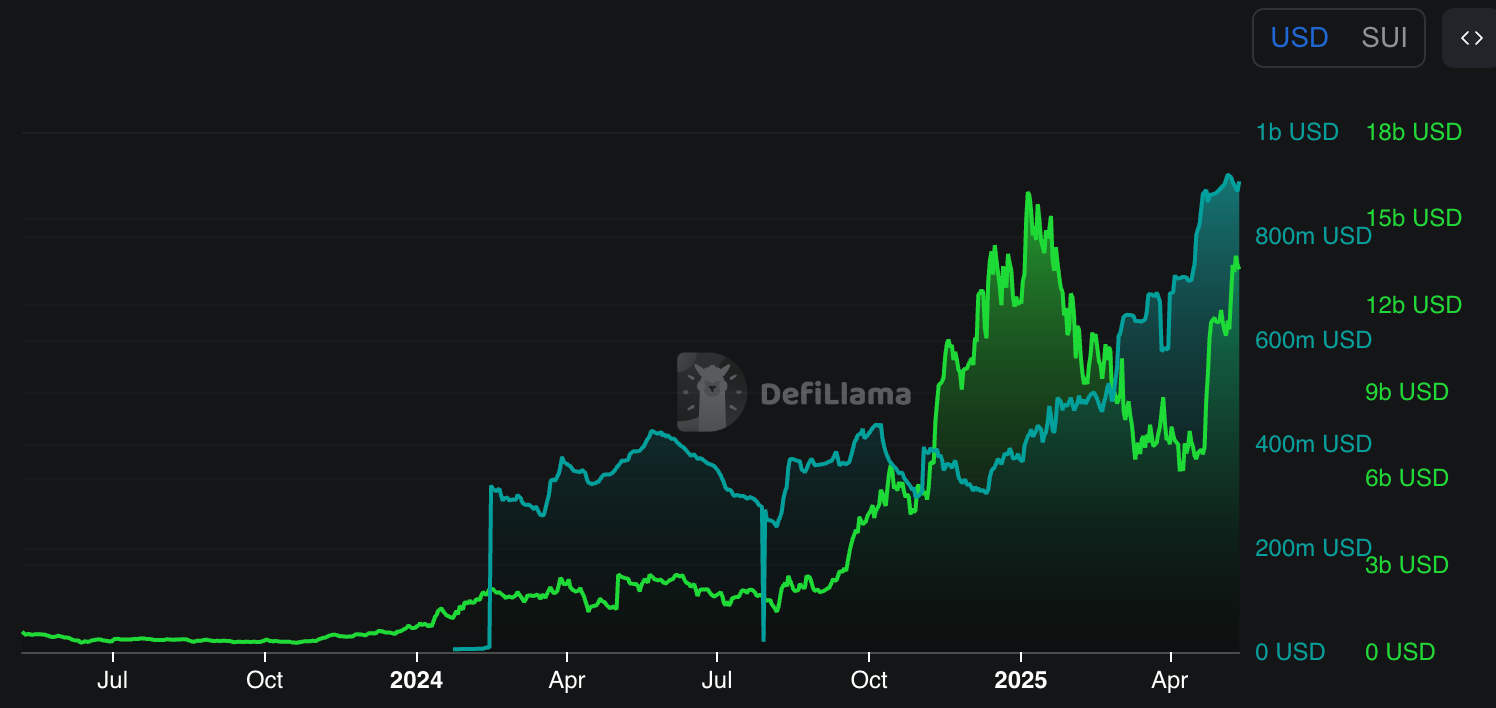
There has been a rise in stablecoin usage on the SUI network, showing more people participating in DeFi. Stablecoin market cap also went up from below $300 million in mid-2024 to over $900 million by May 2025.
This shows that more users are keeping and using SUI on the chain, frequently with SUI-based protocols. The market cap and stablecoin activity show that more people use the SUI ecosystem.
Markets become deeper when more users and liquidity providers come to the network. More liquidity tends to bring in developers, investors, and partners, strengthening the network.
SUI Outpaces Solana in Investment Inflows
Meanwhile, money flowing into digital asset investment products helps show that institutions are paying more attention to SUI.
CoinShares and Bloomberg report that SUI has attracted $84.07 Million in inflows this year. During the same period, Solana has attracted $76.37 Million, less than SUI.
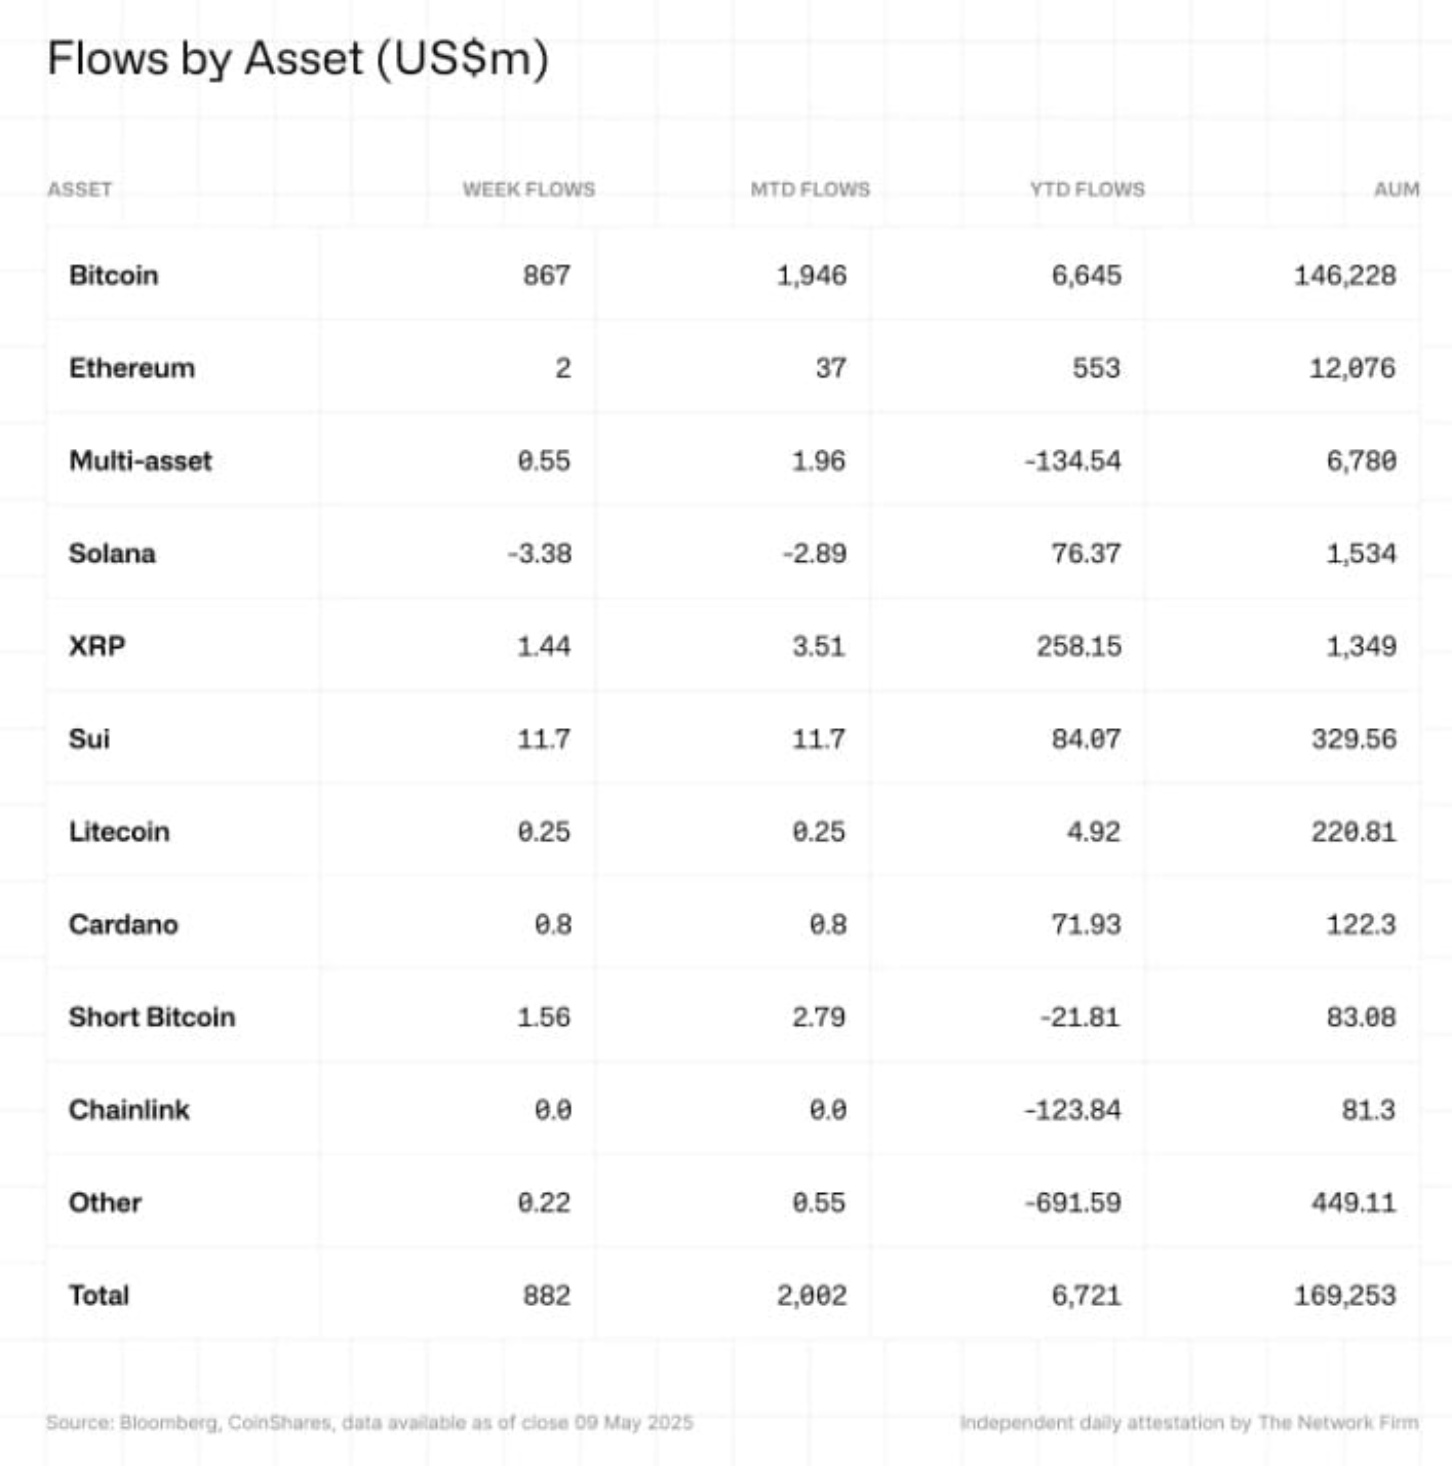
SUI attracted $11.7 Million in the past week, the highest among altcoins. Ethereum attracted $2 Million, but Solana had $3.38 Million leave its investment products. This means investors invest more money into SUI than many established layer-1 networks.
Higher inflows mean institutions are starting to trust the SUI network and its prospects. Such investment vehicles usually indicate the long-term plans of fund managers and crypto hedge funds.
SUI Price Momentum Points to Key Resistance at $5.40
There is a strong upward trend in SUI’s recent price movement. According to an analysis by Ali Charts, the price has successfully broken through several resistance levels. It is now moving toward $5.40, the next significant resistance area on the chart.
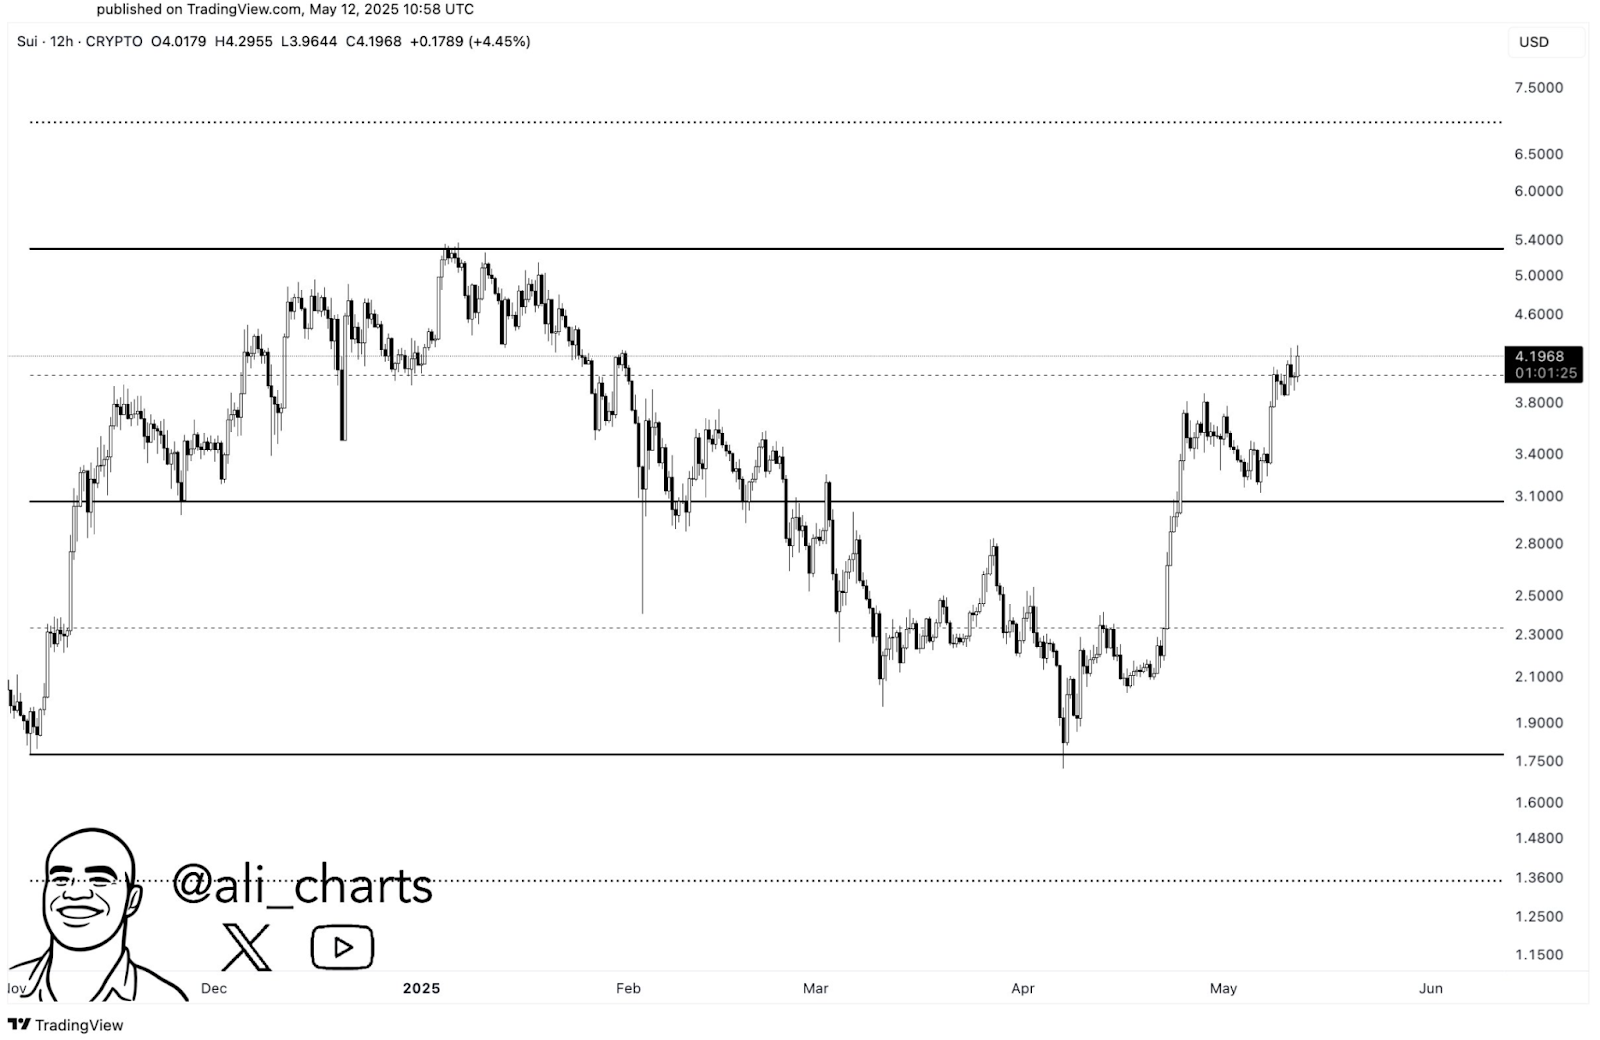
Between February and April 2025, the SUI price remained stable and did not go above $3.10. Since late April, the token has escaped this range and moved past $3.80.
Traders view $5.40 as a key level because it was a resistance point in late 2024. Getting above this level could increase the price to the $6.00–$6.50 range.
The chart’s volume and candle structure confirm the upward trend. If $3.80 holds as support, bulls could push prices even higher.
Disclaimer
This article is for informational purposes only and provides no financial, investment, or other advice. The author or any people mentioned in this article are not responsible for any financial loss that may occur from investing in or trading. Please do your research before making any financial decisions.



