streamoors
 IGNITION
 NEAR Protocol
 Injective
 LayerZero
 Pearl
Pearl Hyperliquid
Key Insights
- Solana price is testing $188 resistance with multiple breakout patterns suggesting a bullish trend continuation.
- Analysts see $200 as a near-term target, with potential extension to $250–$260 if momentum holds.
- SOL structure shows repeated descending resistance breaks followed by rallies above key support levels.
In the past few weeks, Solana (SOL) price has made several technical breakthroughs, catching the attention of investors. With the price close to $188 resistance, analysts have predicted the possibility of it surging and reaching $200 or $250.
Analysts Eye $200 Target for Solana Price
At present, Solana price is trading close to $180–$188, a major resistance area before. Consequently, the market is watching this zone carefully, and several analysts predict that a price of $200 could be reached soon. The bullish outlook is confirmed by increasing SOL prices on the four-hour and daily charts.
Notably, an analyst known as CryptoCurb posted a chart revealing three times that the price broke past resistance levels. After each breakout, Solana price has moved higher, creating a positive continuation pattern. The recent rise above $180 and higher volume might signal that buyers are in charge. Should the price rise above $188 with good volume, the next crucial level is $200.
Technical Structure Points to Solana Price Rally to $250
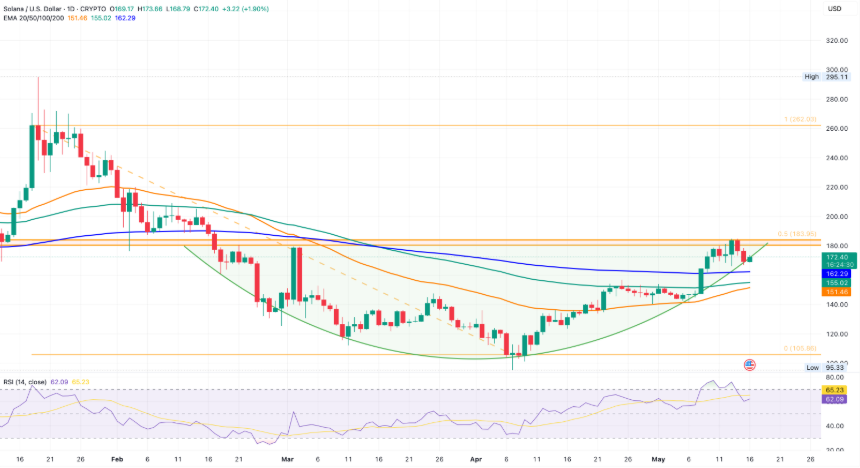
Besides the $200 area, another analyst pointed out that the $250–$260 area could be a target if the present trend holds. In late 2023, this zone was where resistance was encountered. According to Kurnia Bijaksana, Solana price is hovering above $180 and may head toward $250–$260 if it continues to rise.
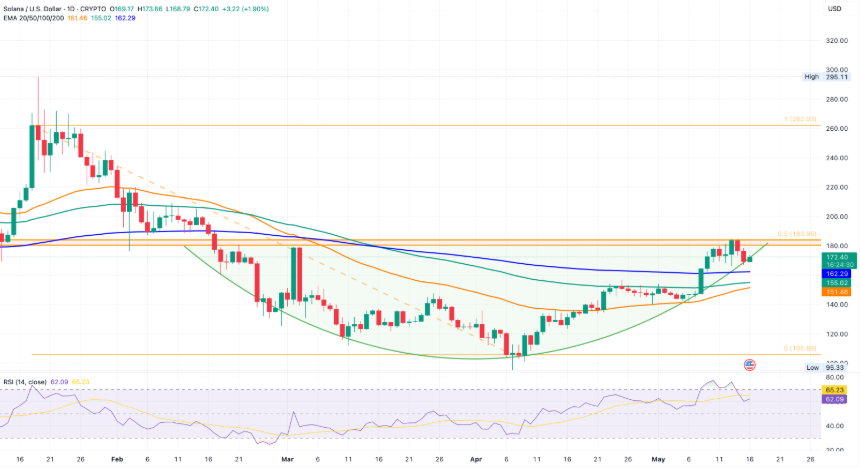
In addition, Bijaksana’s chart pointed out a circular base growing in the market since earlier this year. Higher lows and more trading volume confirm that the bullish trend may continue. Hence, if the breakout is confirmed, the following price swing could lead to a rally to $260.
Another analyst, CoinSignals, noted that Solana price has overcome the $180 resistance zone, an area where it rose to $260 twice before. Looking at the weekly chart, bulls have formed an ascending wedge, with the mid-range capping at $260 and the top target at $320.
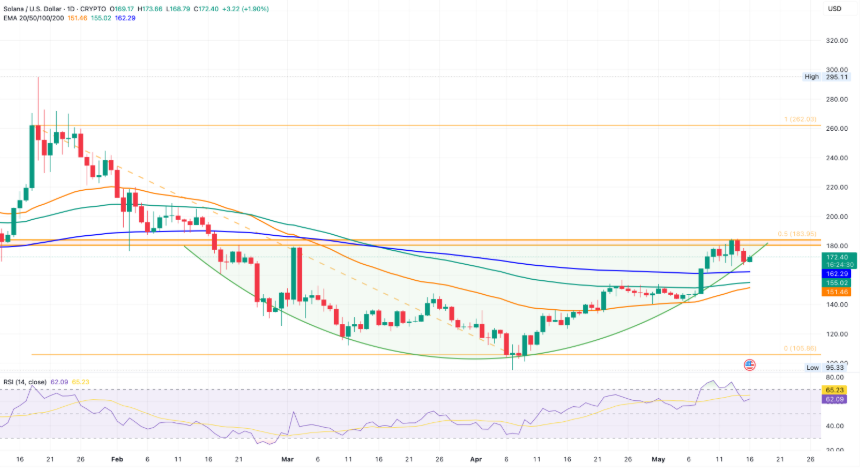
According to the analyst, provided the momentum continues, the top altcoin may return to the $260 level and aim for $320. Breaking above $180 is promising, as historical trends support the upside.
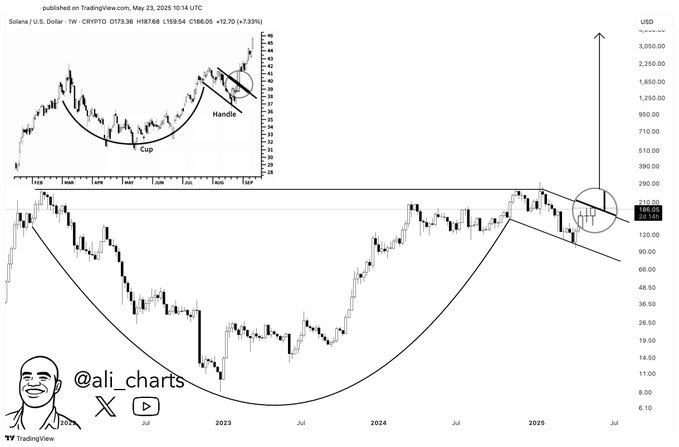
Moreover, analyst Ali Martinez suggested Solana price is forming a large cup-and-handle pattern on the weekly chart. A breakout above the $216 neckline could initiate a parabolic move. The technical setup mirrors historical bullish formations, with upside potential extending far beyond current levels if the pattern completes successfully.
Breakout Patterns Reinforce Bullish Momentum
More so, several breakout patterns in the market have increased confidence in Solana price near-term progress. Such patterns consist of regularly falling prices that bounce off the trendlines and then rise sharply above them. For each event, SOL price peaked during its downtrend and then increased in value afterward.
A breakout above $170 sparked the move up to the $185 area. Similar to what was seen early in the month, this movement began with a breakout that sustained for several days.
While attention is on the $200 and $250 zones, analysts are also keeping watch on key support levels. A failure to hold above $172 may prompt a short-term correction. However, as long as Solana maintains higher lows above $160, the general uptrend remains technically valid.
Further supporting a bullish outlook, recent analysis showed Solana price testing a key resistance zone between $174 and $188. Buy walls were forming near $164–$166.
Analyst data revealed repeated rejections at this range, but a sustained move above $188 could trigger a rally toward $220–$240. Additionally, derivatives metrics showed a positive funding rate, suggesting growing bullish sentiment as traders position for a breakout in the short term.
Disclaimer
In this article, the views, and opinions stated by the author, or any people named are for informational purposes only, and they don’t establish the investment, financial, or any other advice. Trading or investing in cryptocurrency assets comes with a risk of financial loss.