Pearl
Pearl Walrus
 Starknet
 Quantus
 Bitway
 Sui
Sui Zylo Ecosystem

Key Insights
- 70% of altcoins have more long positions than short positions.
- Tokens with the highest long/short ratio are TRUMP, DOT, LINK, XRP, MELANIA etc while those with the lowest long/short ratio are TAIKO, MKR, HYPE, BTC etc.
- Total market of altcoins signaled a bullish chart pattern following a previous bearish one.
More than 70% of altcoins showed a higher share of long positions, according to new data from CryptoTrend. Despite this, several long-heavy tokens underperformed on spot markets, raising concerns of retail-driven overconfidence.
Altcoins Show Diverging Sentiment and Positioning
CryptoTrend’s chart showed that long/short sentiment skewed heavily toward optimism for tokens like TRUMP, DOT, LINK, XRP, and MELANIA. These assets had long/short ratios close to infinity.
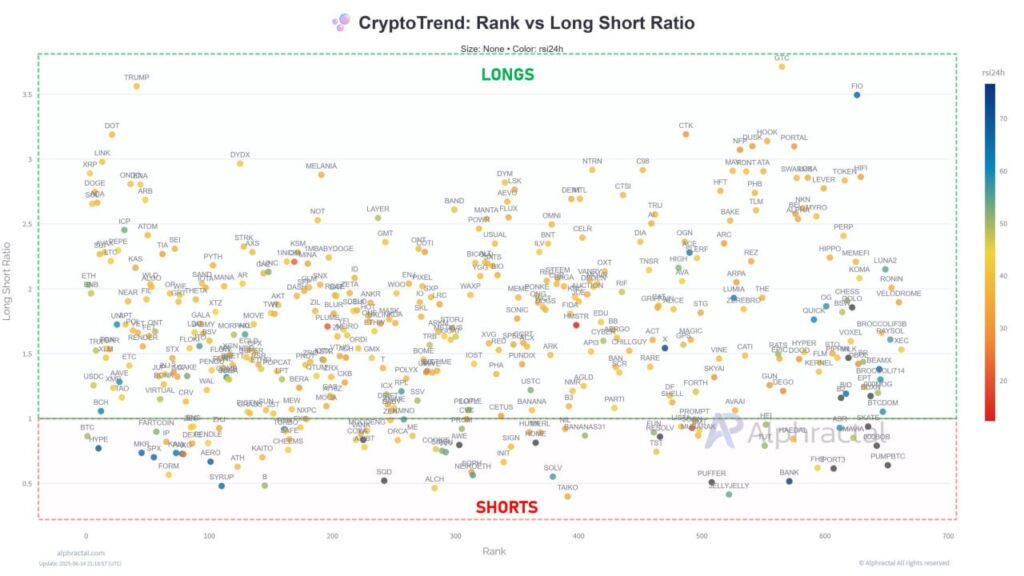
Despite bullish positioning, these tokens declined or stagnated, hinting that whales may be offloading into retail demand. Analysts said this behavior suggested distribution rather than healthy accumulation.
In contrast, TAIKO, MKR, HYPE, and BTC had lower long/short ratios, with shorts dominating. Notably, these tokens outperformed recently, indicating possible hidden accumulation under a bearish front.
This divergence may point to a contrarian setup. Lower-ranked tokens on the sentiment chart could outperform if the market rotates out of overbought positions.
Traders may want to scan undervalued assets with high short interest for potential upside surprises during such rotation phases.
Analysts cautioned that the long/short ratio often acts as a contrarian signal. Bullish setups may appear in ignored assets where sentiment remains negative.
Analysis of Altcoins Market Cap
Additionally, the total altcoin market cap showed a bullish market structure after having a bearish market structure—a classical conducts of prices.
Originally, a double top was acquired at the $1.3T mark and the bearish trend became certified as the price breached the bottom of the neckline.
The breakaway was all the way down to the $770B zone, and it was able to encounter the anticipated double top target, indicated within the graph.
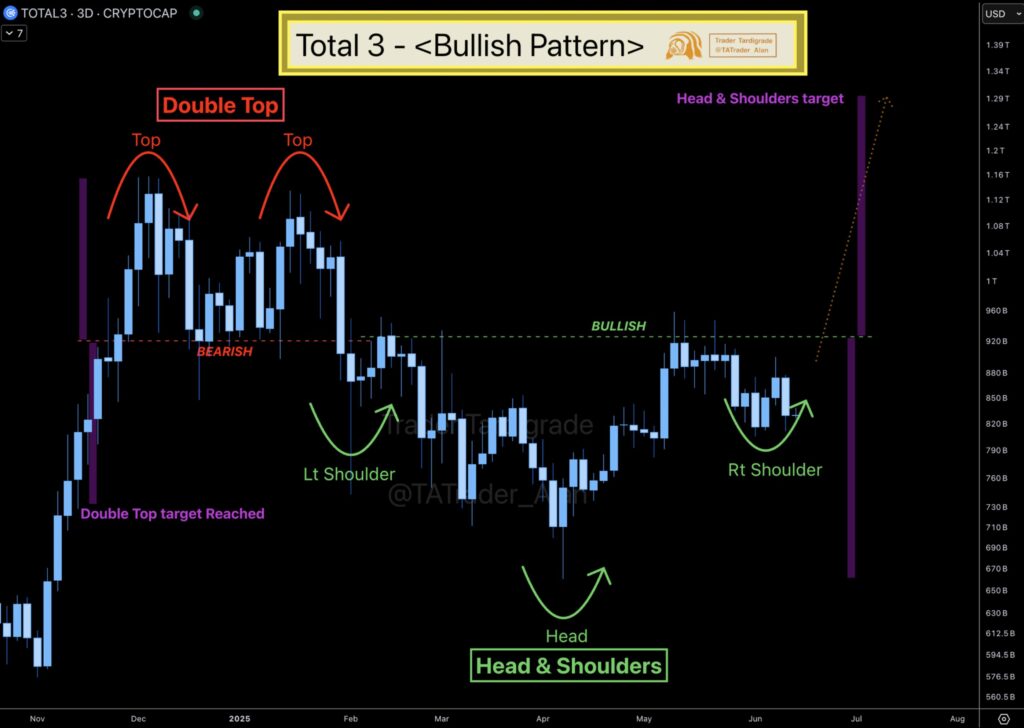
After this fall, a texbook inverted head and shoulders pattern emerged. The left shoulder was around $760B, the head bottomed at $630B and the right shoulder shaped around $790B.
The resistance was at the neckline of about $920B where price lingered.
The break above this neckline may result in a bullish break out, which is expected to reach $1.27T that coincides with the purple marked head and shoulders projection.
But where management does not crack $920B convincingly, there may be a rejection and possible consolidation thus between $790B and $920B.
In case breakdown pressure reappears, then price may test the support zone $760B or below. This tendency denoted a possible macro reversal, which implied that altcoins could be prepared to take off in a bullish direction.
The set-up would be confirmed above $920B, and that could trigger an Altseason. This was an important level that traders observed closely.