Quack AI
 Pearl
Pearl Solana
 NEAR Protocol
 Canton
 XRP
XRP Derive

Key Insights:
- A falling channel and bullish RSI divergence suggest a potential rebound toward $0.00001390 Fibonacci resistance.
- Shiba Inu trades at $0.00001184, holding key support above $0.00001100 amid a 30% decline from May highs.
- A TradingView analyst highlights a descending trendline blocking SHIB rallies since March 2024.
Shiba Inu Coin (SHIB) is in consolidation with a narrowing range, and the chances of a breakout are increasing. As the wider crypto market shows volatility in the short term, Shiba Inu crypto is below a critical area and testing the upper point of a falling channel, raising probability of a rally to the $0.00001390 mark.
Shiba Inu Coin Bullish Technical Indicators
On the daily timeframe, Shiba Inu has been moving within a falling channel pattern since mid-May, following a rejection from the 38.20% Fibonacci retracement level near $0.00001639. The pattern has led to a 30% decline, with the current price hovering around $0.00001184.
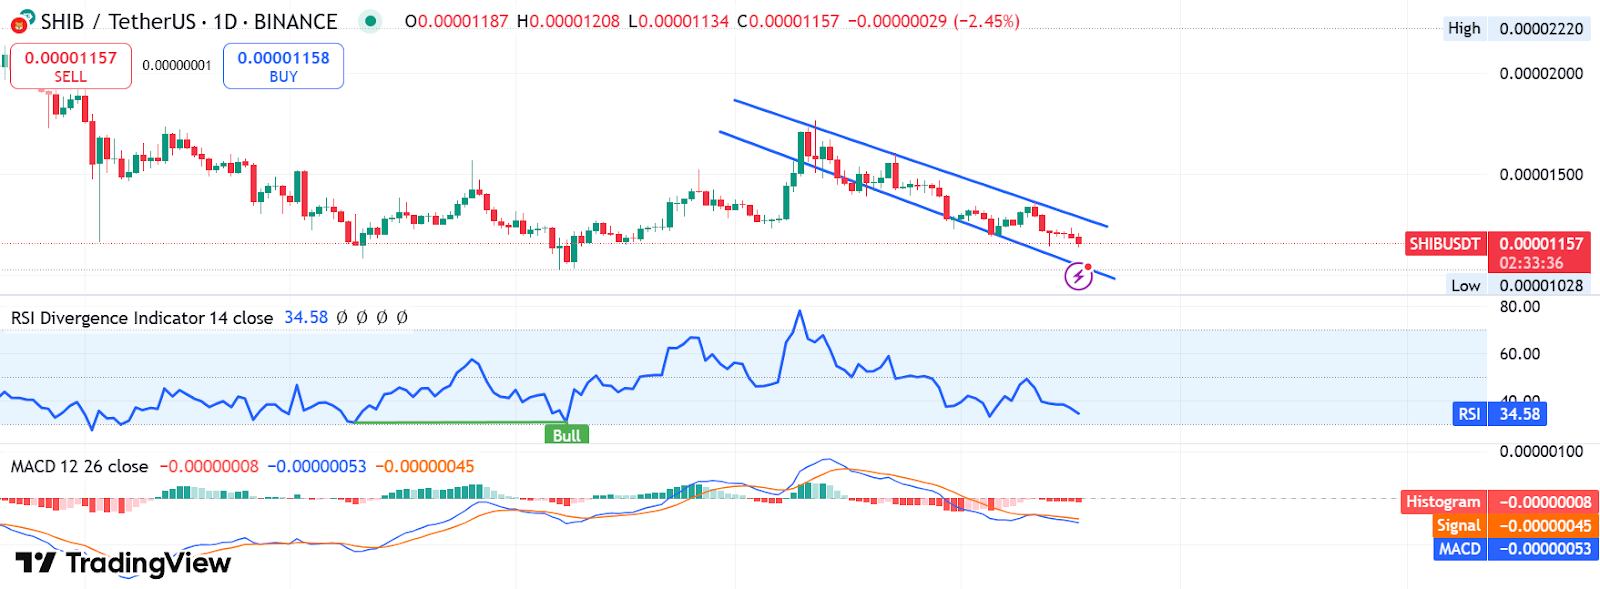
Despite the dip, the meme coin has demonstrated strength on the lower line of the channel. In several sessions, the price has been on support above 0.00001100.
Such consistency, along with a slight bullish divergence in the Relative Strength Index (RSI), provides the possibility of a change in momentum. The positive slope of the RSI conflicts with the falling price, and this combination might indicate price weakness due to the diminishing selling strength.
Further reinforcing this outlook is the Moving Average Convergence Divergence (MACD) indicator. On the daily chart, the MACD line is nearing a crossover with the signal line, a bullish trend reversal. Should this occur, it would provide additional technical support for a move toward the 23.60% Fibonacci level at $0.00001390.
Support Above $0.00001100 Holds After Pullback
Shiba Inu crypto declined from $0.00001639 in May to a recent low near $0.00001154, with the token currently trading near $0.00001184. This move aligns with the upper and lower limits of the falling channel, which have provided clear technical boundaries during the current consolidation.
More so, a critical level to note is the 0.00001100 zone. Another break below this support may unlock more downside, and it may dip to the psychological $0.00001000. Nevertheless, the fact that the Shiba Inu Coin has traded higher than this point provides additional support that it forms the bottom of a potential reversal.
Analyst Observes Persistent Trendline Rejection
According to TradingView analyst Mr Hans, a long-term descending trendline has consistently restricted Shiba Inu crypto upward movements. This trendline has acted as resistance since early March 2024, first near $0.000045 and again in December, close to $0.000033. It continues to serve as a critical barrier to any sustained rally.
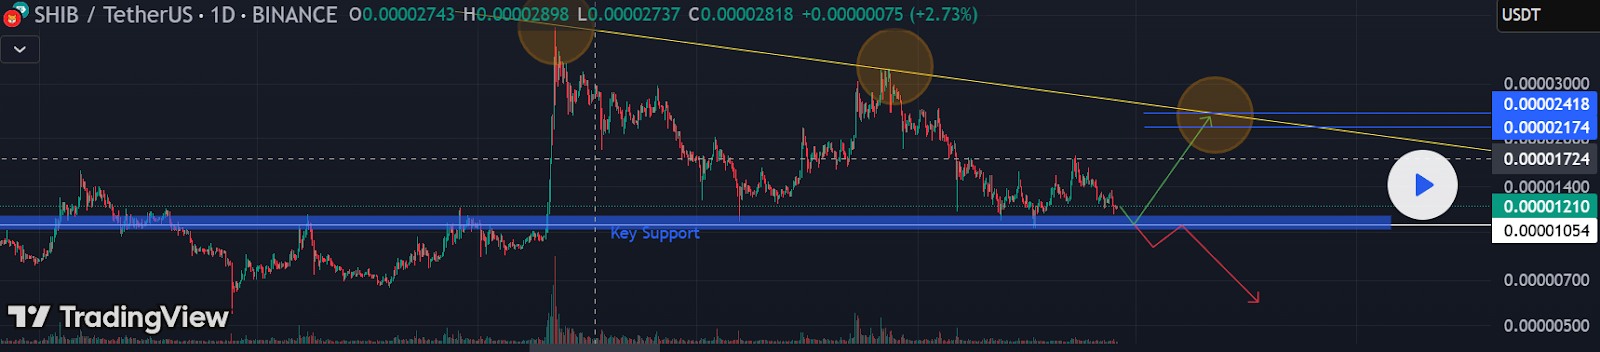
A support band on Mr Hans’ charts between 0.00001133 and 0.00001018 has also been identified. This area was supported during a major correction in the past. In August 2024 and April 2025, SHIB retested this area and recovered.
However, despite these recoveries, Shiba Inu crypto has been constrained by lower highs. This implies that before the upward trend prevails, this falling resistance has to be breached.
Derivatives Data Show Bearish Sentiment
SHIB’s derivatives market showed weak bullish conviction as open interest dropped 2.14% over the past 24 hours to $145.33 million, according to Coinglass. The decline suggested reduced speculative activity.
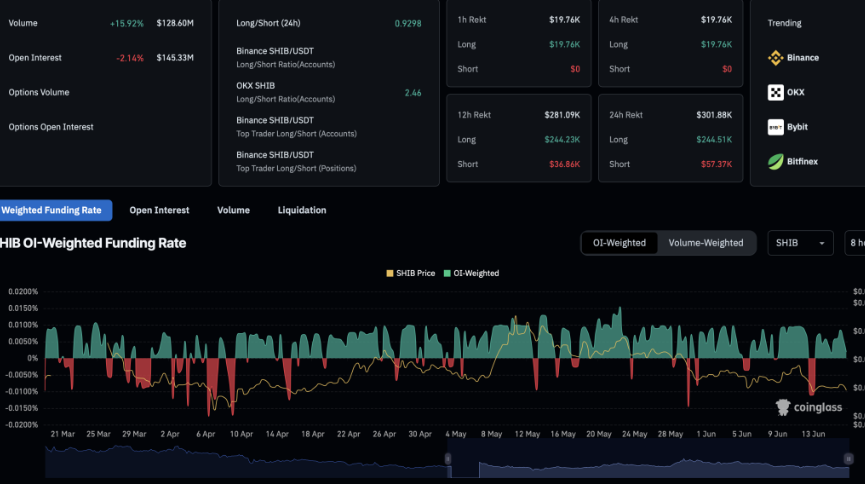
In the same period, long liquidations reached $244,000 compared to $57,000 in short liquidations. The imbalance confirmed aggressive long traders getting wiped out during price dips. The long-to-short ratio dropped to 0.9298, with the funding rate easing to 0.0019%.
The decline in open interest and leveraged longs implies hesitation among traders, even as technical indicators lean bullish. A clear breakout from the falling channel may shift sentiment, but for now, the bias remains mixed.
Disclaimer
This article is for informational purposes only and provides no financial, investment, or other advice. The author or any people mentioned in this article are not responsible for any financial loss that may occur from investing in or trading. Please do your research before making any financial decisions.