
 Pearl
Pearl Ondo
Ondo Ethereum
 Bitway
 Derive
 Pudgy Penguins
 NEAR Protocol

Key Insights:
- Dogecoin Price forms ascending triangle, signaling possible breakout toward $0.20.
- Bullish indicators emerge, but confirmation needed for upward continuation.
- Support holds at $0.17; resistance looms near $0.18 level.
Dogecoin (DOGE) price has remained in consolidation this week, holding above the key support level of $0.17. Despite a recent pullback, DOGE still appears poised for potential gains if bullish sentiment returns.
Dogecoin (DOGE) held steady above the $0.17 support zone during the week, despite broader market corrections. Although the token slipped nearly 10% over the past seven days, it maintained a consolidation structure that hinted at possible upside if sentiment turned bullish.
The broader market remained cautious, with Bitcoin (BTC) hovering near $104,000 and Ethereum (ETH) around $2,500. Analysts noted that traders were watching closely for signs of a broader trend reversal.
Dogecoin Price Consolidating in Ascending Triangle
Crypto analyst Trader Tardigrade tweeted that the Dogecoin price might be forming an ascending triangle pattern on its hourly chart. This technical formation, observed in lower time frames, suggests potential bullish momentum building at the asset’s base.
According to the analyst, horizontal resistance aligns near $0.171, while higher lows create a rising trendline. This pattern typically signals that buyers are gradually gaining strength, often preceding a breakout to the upside if resistance is breached.
The expert also outlines a possible future price path, including a retest of the support line before any breakout attempt.
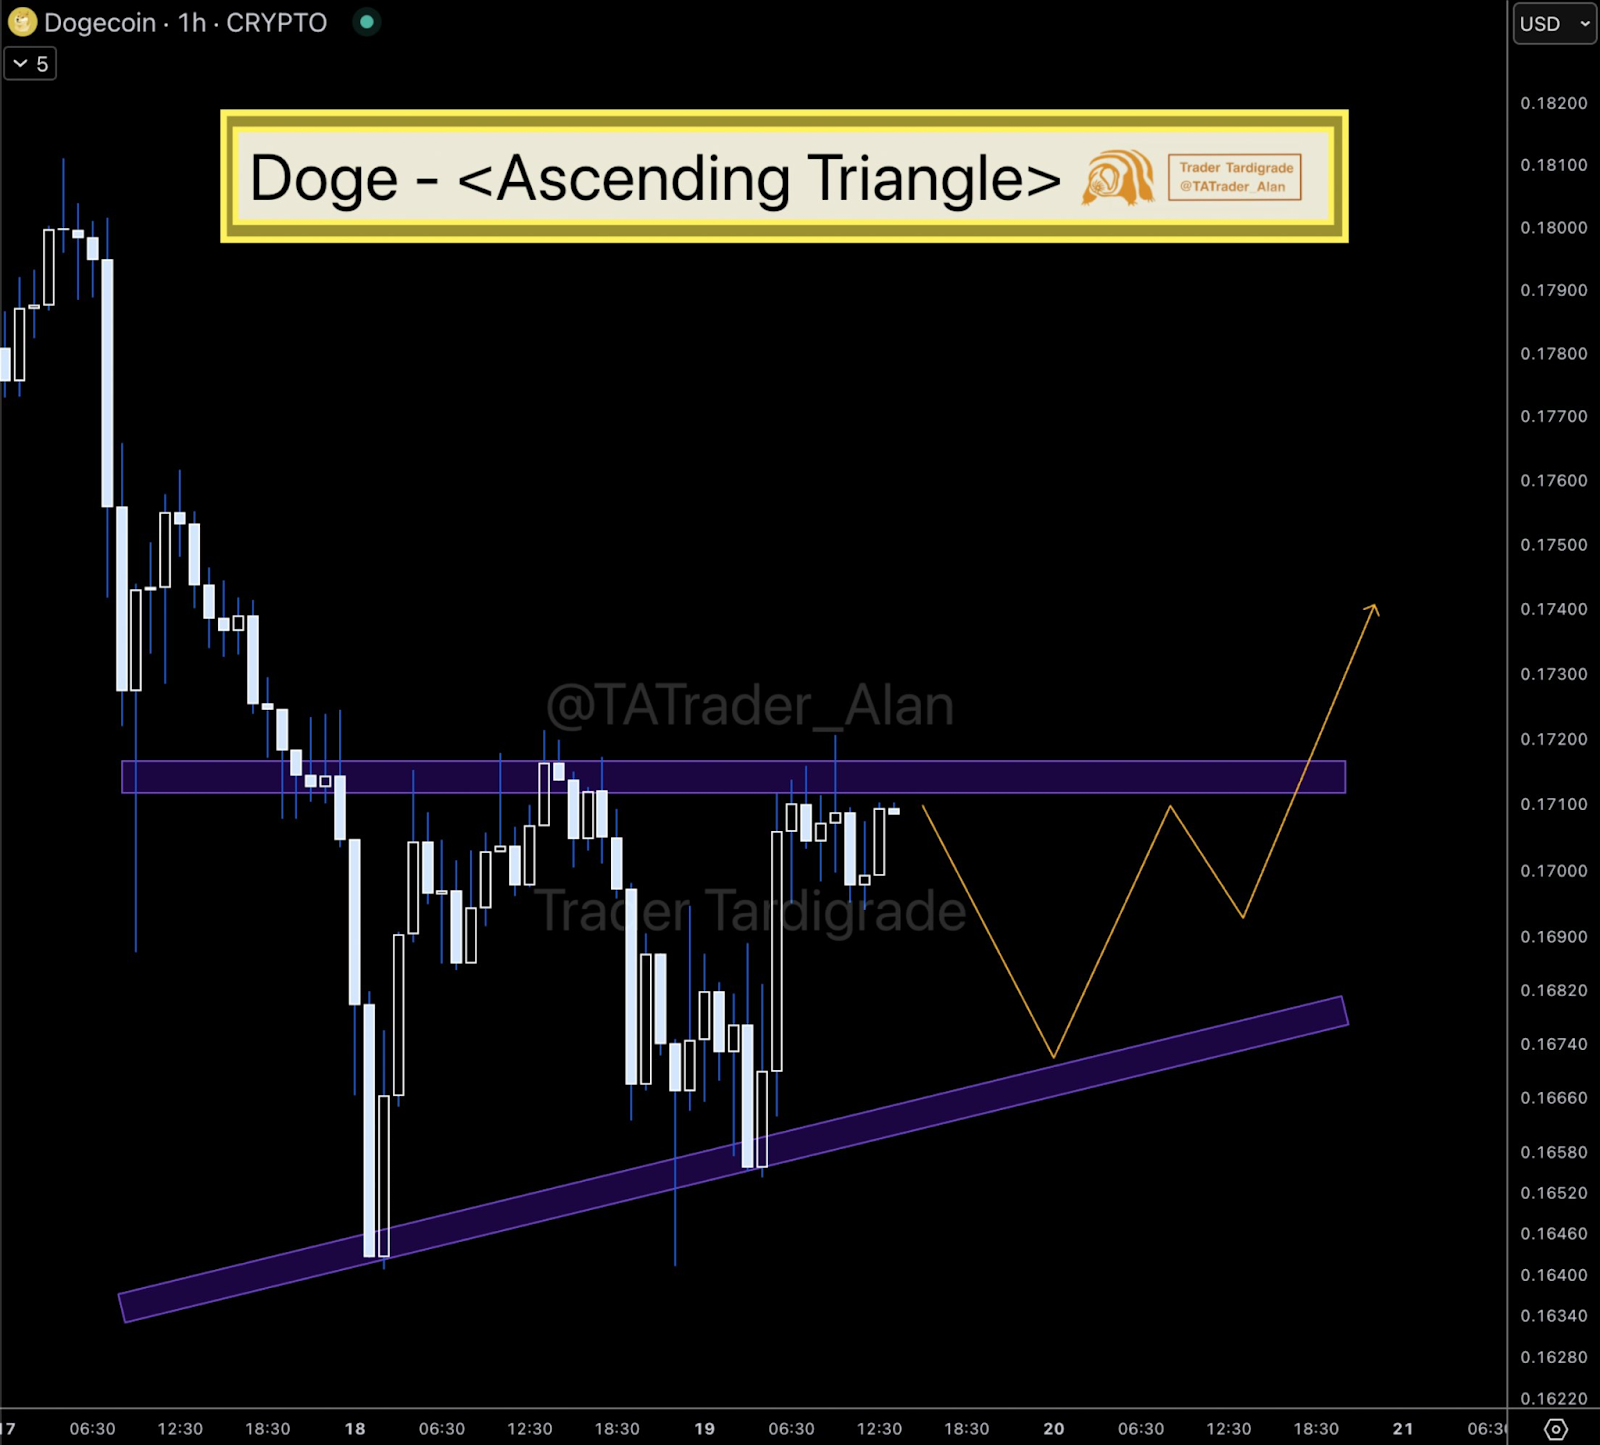
An upward move beyond the resistance could indicate growing confidence among traders and ignite renewed interest in the Dogecoin price. While this setup hints at a bullish reversal, analysts caution that confirmation is required before acting.
Dogecoin Poised for Major Rally, Analyst Eyes $0.60
Dogecoin price could be on track for a major breakout, an analyst suggests, citing a repeating pattern from early 2022. The well-known 4-year crypto cycle appears to remain intact, and recent Dogecoin movements mirror historical setups.
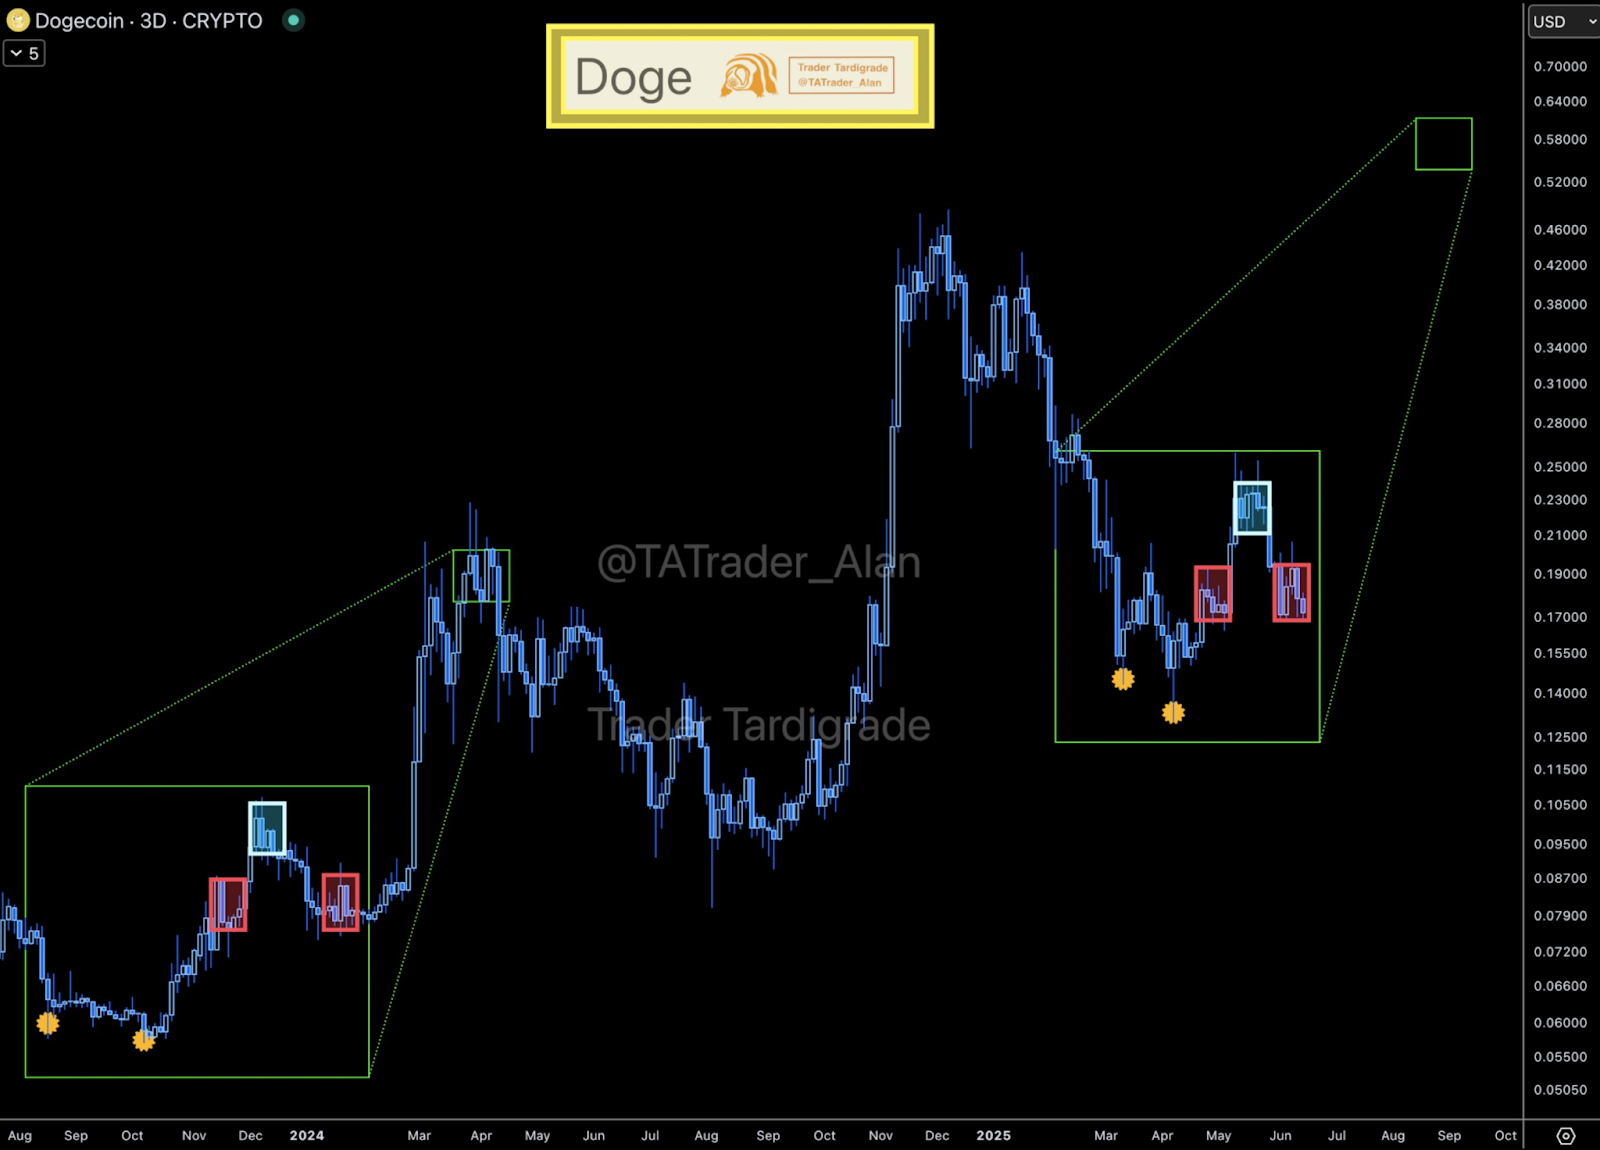
According to trading insights, if this trend continues, the DOGE price may be positioned for a steep rally. Chart comparisons reveal strong similarities to its previous surge that led to early 2024 highs.
Technical charts that have been characterized by crypto analysts reveal that Dogecoin could be hitting high to the tune of $0.60 in the fall of 2025. Increased points of the chart refer to similar price movements, especially during the consolidation and breakout period.
Such consecutive signs are encouraging traders to engage in a bullish mood. In case the price of Dogecoin is similar to the trend, analysts suppose a large increase may be in place.
How High Can DOGE Price Go In June?
As of the latest update, the DOGE price hovers at $0.1698, making a slight surge of 0.07% in the past 24 hours.
Nonetheless, the Dogecoin market remains at a lower price as the potential resistance levels are at risk, meaning that the market is showing restrained optimism.
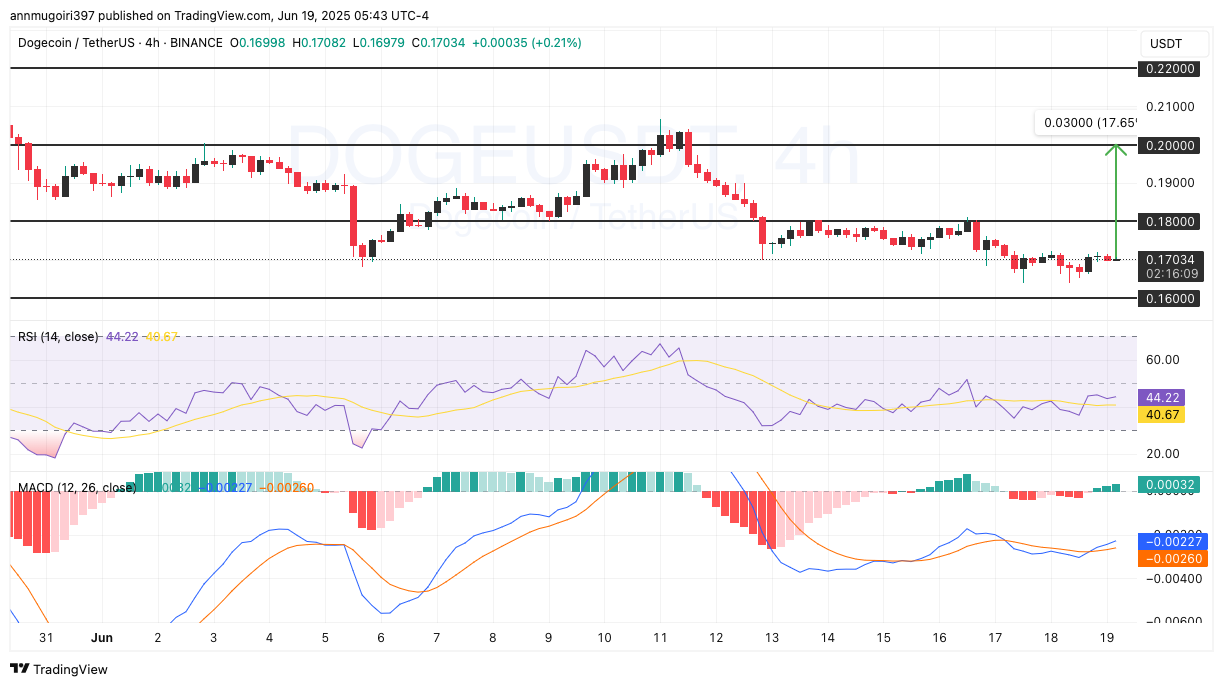
The 4 hour chart indicates a well squeezed consolidation. DOGE has been trading in the upper channel of the support(0.1600) and the resistance (0.1800).
The Relative Strength Index (RSI) is at the 44 reading at the moment, and this indicates a devoid of sentiment on the part of traders. The RSI is under the 50 level, which means that the asset is still under the bearish pressure.
There is also a narrow divergence in the Moving Average Convergence Divergence ( MACD ). MACD line is slightly higher than signal line, which creates an impression of the potential bullish crossover in case there would be the increased volume of buying.
This arrangement shows that there might be a price trend in the near future but the momentum is not strong at the present time.
Technically, if the Dogecoin price breaks above the $0.18 resistance level, it could trigger a 17% rally toward the $0.20 target zone.
Conversely, when sellers take charge, then DOGE price can be tested on the support line at the $0.16 price mark once more. A decline beyond this point will have a bearing of laptimes in the 0.15 neighborhood.
Disclaimer
This article is for informational purposes only and provides no financial, investment, or other advice. The author or any people mentioned in this article are not responsible for any financial loss that may occur from investing in or trading. Please do your research before making any financial decisions.



