
 Pearl
Pearl Puffer
 NEAR Protocol
 ZKsync
 Bitcoin
 Solana
 Starknet
Key Insights:
- Shiba Inu price faces a critical test at $0.0000113 support; failure could lead to a 50% drop to $0.0000054.
- Despite a 1,900% burn rate surge, SHIB’s price remains stagnant amid declining ecosystem activity and TVL drop.
- SHIB’s descending triangle signals bearish trend, with RSI at 39.18 and a potential 51.55% decline if support breaks.
Shiba Inu (SHIB) is currently facing a critical test in its price movement. At $0.0000111, SHIB has been showing signs of continued bearish momentum, primarily due to the formation of a descending triangle on its weekly chart. The support level at $0.0000113 is crucial. A breakdown below this level could result in a significant decline, with some analysts predicting a potential 50% drop to as low as $0.0000054. This could mark a new multi-year low for the token.
SHIB Burn Rate Spikes but Fails to Boost Price Movement
The Shiba Inu burn rate surged by 1,900% in the last 24 hours, with over 13.5 million SHIB tokens removed from circulation, according to Shibburn data. While this increase in the burn rate is often seen as a positive for SHIB, it has not led to any significant price boost. The primary aim of token burns is to reduce supply, which should theoretically drive up prices if demand follows suit. However, SHIB’s price continues to show weakness, possibly due to broader market conditions.
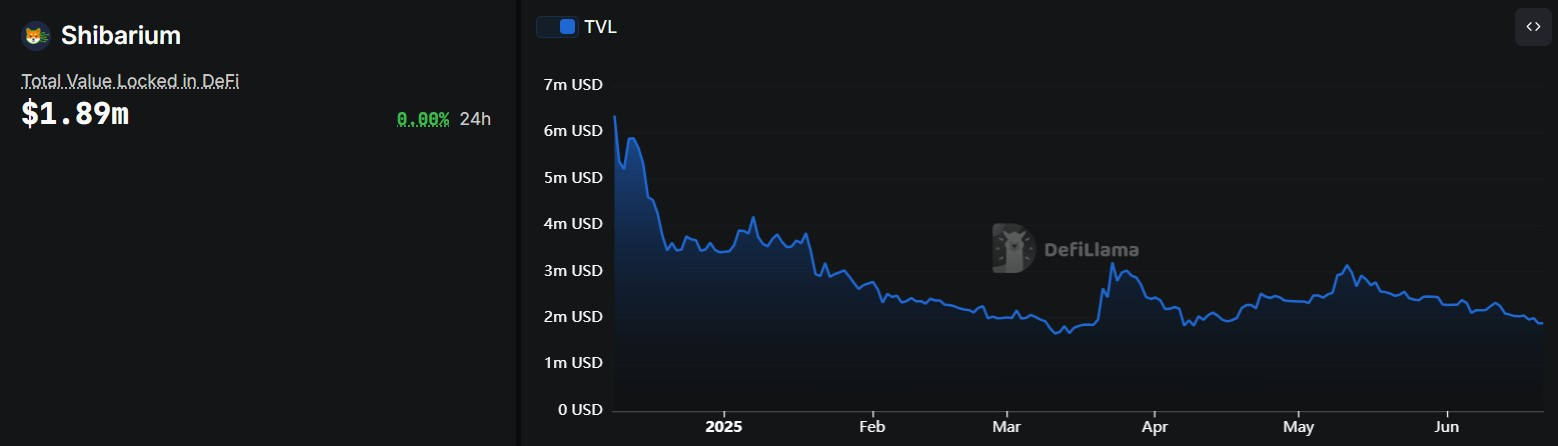
One reason for the muted price reaction is the decline in Shiba Inu’s ecosystem activity. Shibarium, the layer-2 network for SHIB, has experienced a nearly 50% drop in its total value locked (TVL) over the past six weeks. The TVL fell from $3.14 million on May 11 to just $1.89 million, signaling reduced user engagement and transaction activity.
Furthermore, SHIB’s price faces continued downside risk, with the market sentiment remaining negative. Sharp declines in funding rates and increasing short bets indicate that traders are anticipating further price drops. Despite the recent burn rate spike, the broader technical and fundamental factors point toward additional bearish pressure on SHIB.
Shiba Inu Price Derivatives Market Reflects Bearish Sentiment
Shiba Inu (SHIB) has been showing signs of bearish sentiment, as recent data reveals a significant decrease in both trading volume and open interest. The trading volume dropped by 16.71%, bringing the total volume to $89.33 million.
This suggests lower market participation and indicates potential consolidation or lack of direction in SHIB’s price movement. Furthermore, open interest fell by 2.86%, now standing at $127.51 million, which implies traders are reducing their positions or closing leveraged contracts. This points to a more cautious market sentiment as the downtrend continues.
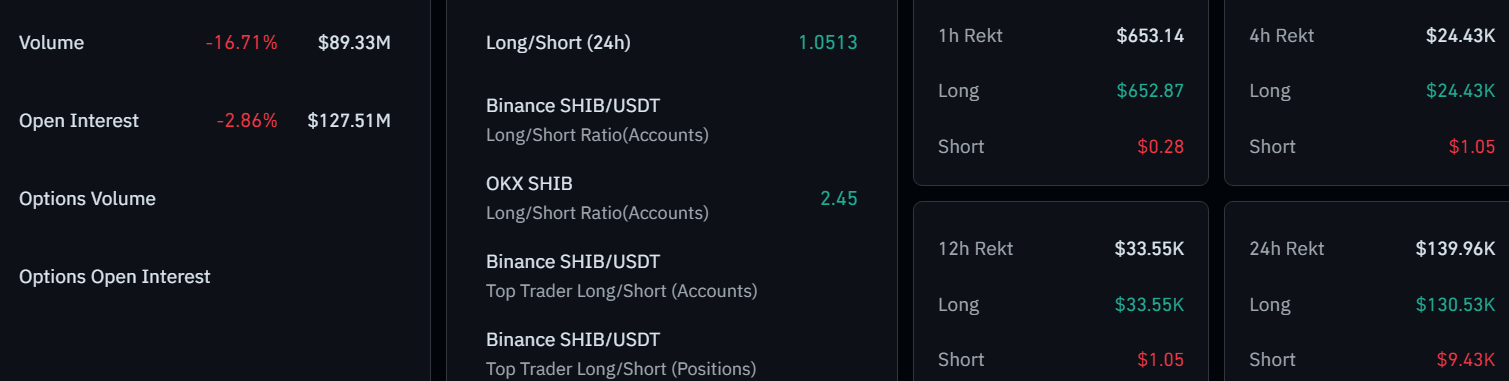
In addition, liquidation data further supports the bearish outlook. Over the past 24 hours, long positions worth $139.96K were liquidated, with a significant proportion of these liquidations from long positions. This highlights the pressure the market is facing, with traders forced to exit positions due to a sharp price downturn.
Despite a slightly bullish bias on OKX, with a long/short ratio of 2.45, the overall sentiment remains bearish, as liquidations dominate the market.
Descending Triangle Signals Bearish Trend for Shiba Inu Price
According to TradingView, Shiba Inu (SHIB) is currently forming a descending triangle pattern on the weekly chart, indicating a potential downside if the support at $0.00001137 breaks.
Horizontal support Ability has tested multiple times, however, the sloping down of the upper trendline indicates that selling pressure is increasing. In case SHIB falls below the support, there might be a further 51.55 drop, and the price can reach a new bottom of 0.00000549.
The price action indicates that there is a massive bull run followed by a long time consolidation. This consolidation process suggests that the buying force is declining and sellers are slowly taking over. The break of the support may send SHIB reverse with additional downs as the asset fails to hold its growth.
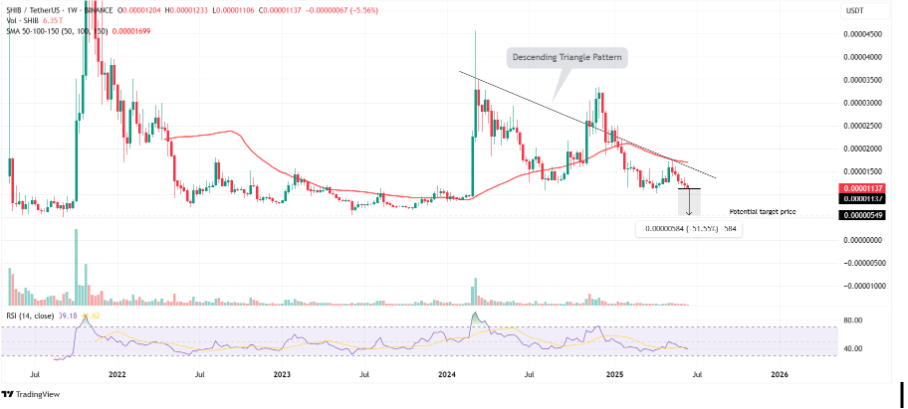
The Relative Strength Index (RSI) is at 39.18, which indicates increasing bearish tensions, and it continues to decline beneath the 50-day simple moving average (SMA) of 0.0000169. Until SHIB reclaims higher key resistance marks, the near-term conditions are bearish.
Disclaimer
This article is for informational purposes only and provides no financial, investment, or other advice. The author or any people mentioned in this article are not responsible for any financial loss that may occur from investing in or trading. Please do your research before making any financial decisions.



