
 Zylo Ecosystem
 Walrus
 Bitcoin
 Sui
Sui Quantus
 Quant
Quant Starknet

Key Highlights:
- Bullish continuation pattern forms, signaling a potential upside breakout.
- Aave rebounds strongly from support, and rallies toward $300 are likely.
- A break above 0.236 Fib may trigger a buying frenzy.
Aave price has significantly surged in the past 24 hours, continuing its upward movement. The cryptocurrency has experienced a remarkable rally this week. Climbing above $260, it signaled a bullish trend.
Despite a recent correction from its peak, AAVE price maintains its positive momentum. The token is now nearing a key support level, which could set the stage for further gains.
Analysts are watching closely as the Aave price eyes the $300 mark. The market sentiment remains optimistic, with AAVE‘s bullish structure pointing to potential growth. Also, traders are hopeful for more upward movement in the coming days.
Aave Price Set for Major Bullish Breakout Soon
Crypto analysts have mentioned that the crypto price is ready to move upward by creating a bullish breakout. This happened after it showed a reversal to the 0.5-0.618 Fibonacci mark on the weekly chart.
Such price behavior and behavior signal the formation of a potential continuation pattern. Therefore, the token is gaining steam. This level of support might play host to a notable upsurge.
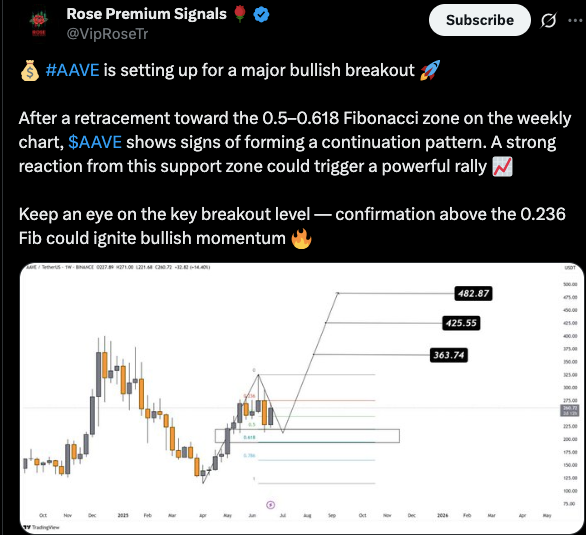
Some of the key levels to monitor a breakout are the 0.236 Fibonacci level. This could trigger bullish momentum once it rises. Traders focus on the upcoming price action to confirm the continuation and potential for substantial price growth.
With the Fibonacci retracement levels guiding the way, the AAVE price might be poised for a significant rise. The price targets are $482.87, $425.55, and $363.74. The market sentiment is closely watched for confirmation of a rally from these technical indicators.
AAVE Price Hits Record Highs in Lending Activity, Signaling Strong Market Position
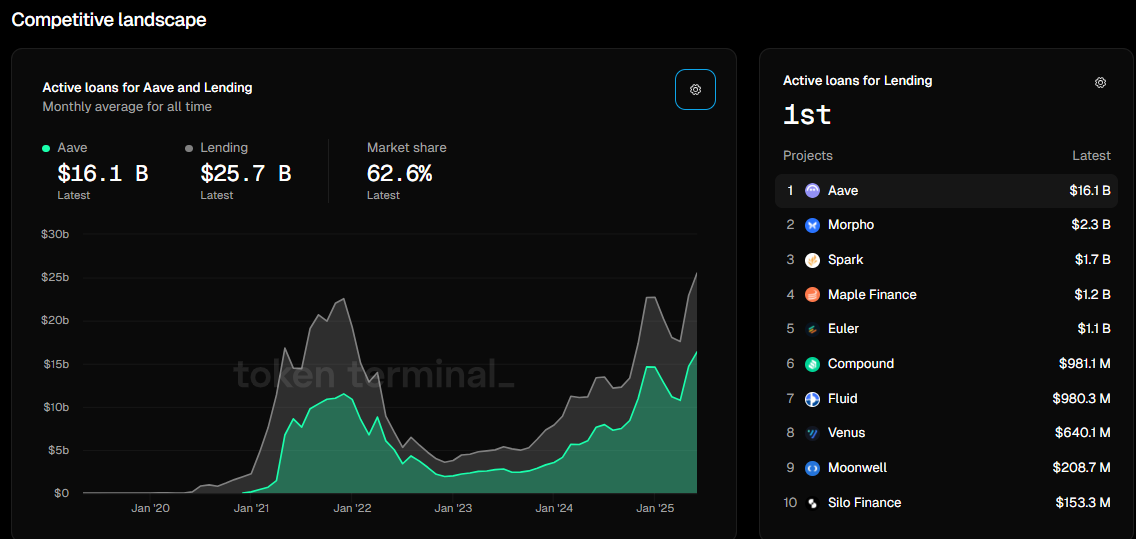
According to the information provided by Token Terminal, as of June, AAVE achieved $16.1 Billion in active monthly loans. This is the highest figure in history and indicates how dominant Aave has become in decentralized finance.
Statistics also indicate that Aave commands a total 62.6 percent market share. It is more than the key competition in the industry, like Morpho and Spark. This drastic rise in lending volume indicates increased confidence in users and general usage of the platform.
Besides, the derivative data on Coinglass illustrates bullish moods on the part of traders. The ratio of long to short positions in AAVE has increased to 1.07, the highest in a month.
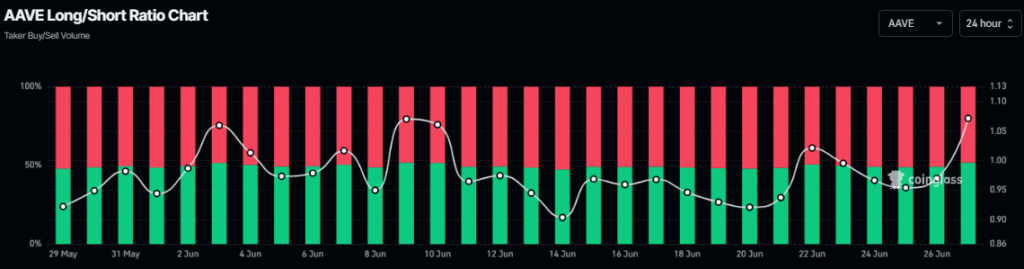
A ratio of greater than one indicates more longs are compared to shorts. This shows traders are anticipating an Aave price rally. All these on-chain and derivative indicators suggest a possible near-term bullish view of AAVE.
Will Aave Price Break $260 and Rally to $300?
At the time of writing, the AAVE price traded at $254.55, showing signs of hesitation below the $260 mark. The altcoin struggled to stay above the minor support-turned-resistance at $260. This reflects growing uncertainty among short-term traders.
Technical signals demonstrate the ambiguous mood. The MACD line is flat-lined, and the signal line is above the MACD line. This implies a bearing on the bullish momentum and increases the likelihood of consolidation.
The Relative Strength Index (RSI) is slightly bearish, with a value of 48.22 below its signal line. Support lies firmly at the $250 level, where previous demand zones cushioned recent sell-offs.
If the Bulls fail to defend this mark, the Aave price could slide toward the next key level, nearly $240. A decisive break below that would open the door to a retest of $225.
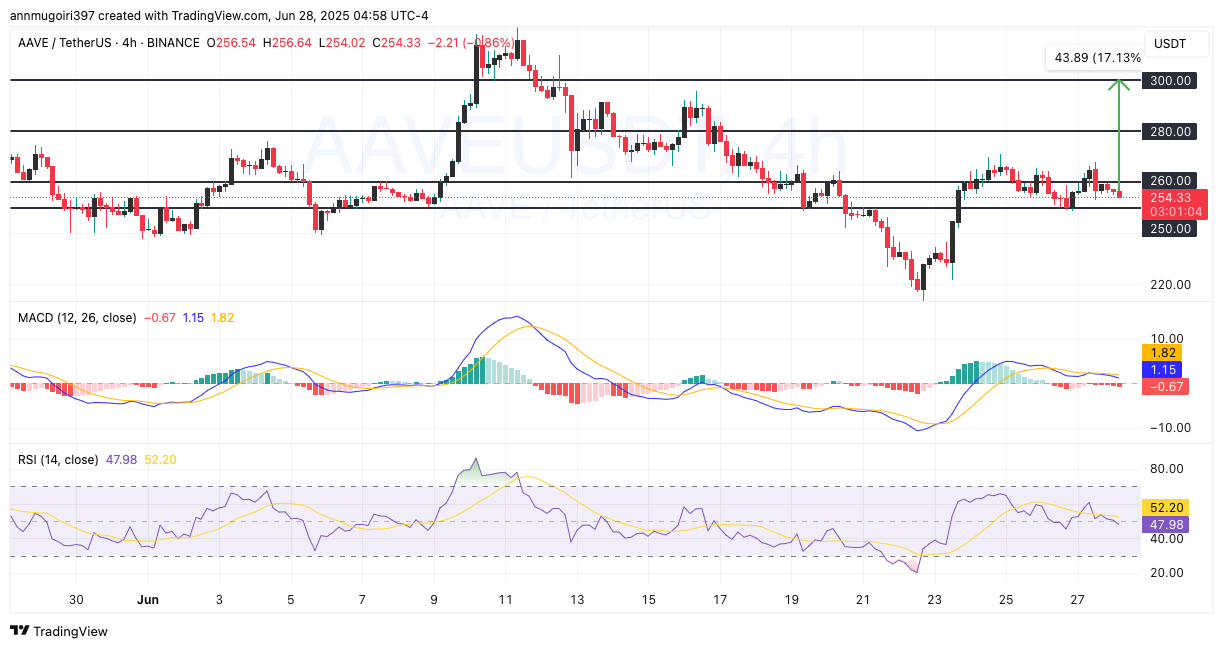
On the positive side, the short-term sentiment can be changed with a clean break above 260. Should the AAVE price break $260 with volume, a new target may be adjusted to about $280. This area corresponds to an earlier peak and starts a formidable resistance area.
If the bullish pressure continues, the Aave price may gain a bullish rally towards $300. It would be a 17.13% appreciation off the current value and finish the expected breakout.
Disclaimer
This article is for informational purposes only and provides no financial, investment, or other advice. The author or any people mentioned in this article are not responsible for any financial loss that may occur from investing in or trading. Please do your research before making any financial decisions.



