
 Altai the Tiger
 Sword Inu
 streamoors
 IGNITION
 NEAR Protocol
 Pearl
Pearl Injective

Key Insights:
- Chainlink price broke out of a symmetrical triangle with daily closes above $15.60.
- A W-pattern neckline at $16.20 sets up a possible move to $31.07 on confirmation.
- LINK now trades above 50- and 100-day moving averages, reinforcing the bullish setup.
Chainlink price has begun rallying after breaking resistance levels above $15. Analysts see further upside potential, with price targets between $26 and $31. The bullish force is on the rise, with chart patterns and on-chain indicators suggesting there is pressure building up.
Chainlink Price Confirms Triangle Breakout to $26
According to ZAYK Charts, a symmetrical triangle was broken on the Chainlink daily chart. The pattern had formed since late 2023, with consistent lower highs and higher lows compressing into a consolidation zone.
The breakout happened as Chainlink price surged above the upper trendline with strong momentum.
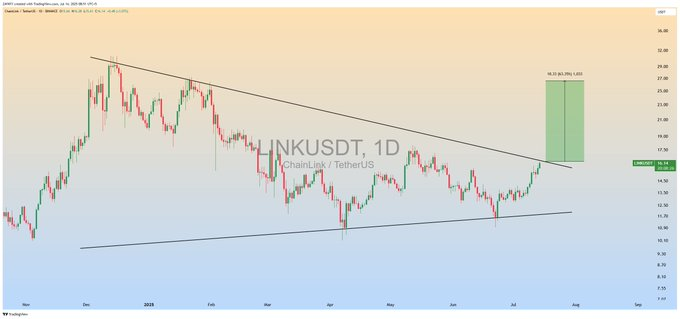
Additionally, ZAYK had an estimated upside of 52.33% and a target of close to $26. The breakout is consistent with the historical triangle trend, wherein a prolonged break through resistance initiated a continuation trend.
Remarkably, a daily close above $17.50 would probably reaffirm higher prices. LINK price has broken out of consolidation and entered an uptrend. If LINK stays above the trendline, it could rally toward $26.
W Pattern and Neckline Aims for $31
Another analyst pointed out a textbook W-pattern on the 3-day LINK/USDT chart. The neckline is located around $18, and Chainlink price is testing that level. A breakout above the neckline may signal the beginning of the move towards $31.
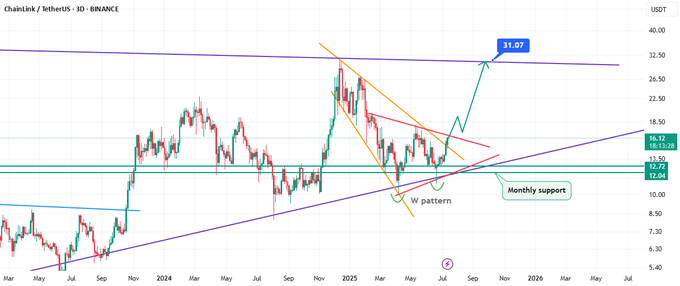
W-shape occurs when two swing lows are formed by a market that has a peak in the middle. In Chainlink price scenario, the first bottom occurred near $11, and the second formed around $12.70. That was later followed by support levels and an effort to regain the neckline.
Also, the neckline coincided with a bearish trendline formed in March 2024. This convergence increased breakout reliability. A consolidation above $18 would validate the trend and trigger a powerful run.
Meanwhile, the ascending macro support from 2023 remains intact. Since bottoming at about $5.50, LINK price has registered higher lows. Those signals indicated structural strength and growing investor confidence.
If Chainlink price clears $18 with volume, $31 becomes the next high-probability target. However, failure to recover the neckline could still lead to consolidation in the short run.
Daily Resistance at $16 Defines Next Move
According to CRYPTOWZRD, Chainlink price is trying to build a major daily resistance level at the $16 mark. It is a critical decision point, as per his analysis. As soon as there is a clean break above $16, it can potentially run to $30 or more.
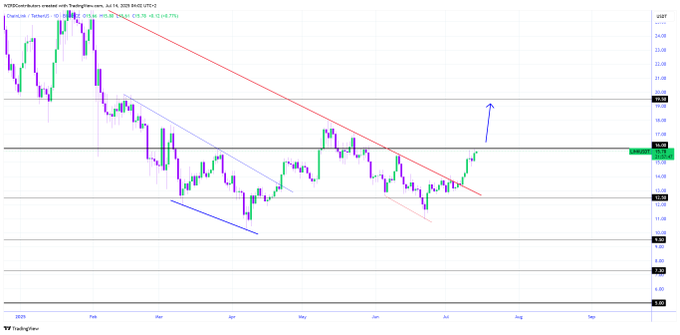
He highlighted that LINK and LINKBTC were ending bullish in weekly and daily charts. This two-fold validation indicates a robust momentum in the Fiat and Bitcoin pairs. Such conditions often preceded breakouts in trending markets.
Moreover, the resistance level will be at $16.62. CRYPTOWZRD sees $14.42 as downside support if rejection occurs. The intraday chart has a double bottom formation that supports the bullish thesis.
CRYPTOWZRD noted that volatility is expected to rise. His intraday outlook indicated that the $15.85 area is critical to remain in a bullish posture.
Analyst Confirms Macro Bottom with $30 Target
Meanwhile, analyst Hardy confirmed a huge double bottom on the weekly chart. This bullish reversal pattern emerged after months of accumulation. According to Hardy, Chainlink price is now above $15 and may target $20 to $30 next.
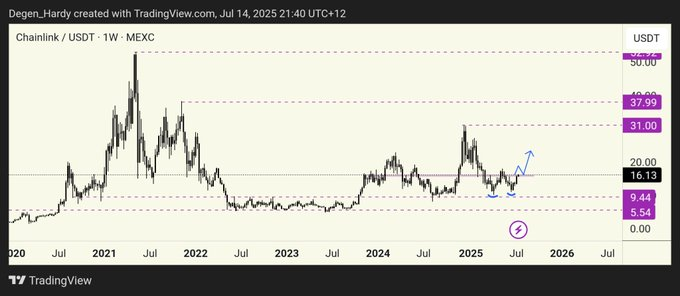
He cited three core drivers. First, strong on-chain demand is returning to Chainlink. Second, large partners such as Visa and Mastercard add utility value over time. Third, altcoin stories are attracting investor focus in the market.
Hardy emphasized that LINK price has exited its accumulation zone. The breakout structure remains valid above $15. Weekly support is staying firm, and upside targets are $30 and potentially as high as $37 with the momentum in place.
Disclaimer
This article is for informational purposes only and provides no financial, investment, or other advice. The author or any people mentioned in this article are not responsible for any financial loss that may occur from investing in or trading. Please do your research before making any financial decisions.




