Bitcoin
 ZKsync
 Pudgy Penguins
 Pearl
Pearl Quantus
 Starknet
 NEAR Protocol

Key Insights:
- MicroStrategy’s MSTR stock clears eight-month resistance zone with substantial closing volume.
- MACD and RSI momentum suggest potential continuation toward $540.
- Bitcoin’s new high lifts MicroStrategy’s crypto holdings above $25B.
MicroStrategy’s MSTR stock rallied by 3.04 % and closed at the daily high of $434.58 (up 12.84). It has been a major technical breakout as the stock is currently trading above all large volume-by-price groupings in the past eight months.
The daily chart records a clean near close above $430. It has been a robust region of sales in the calendar year of 2023, through the month of March 2024.
Such a breakout is supported by heavy trade. There were over $18.4 million shares traded on Friday, indicating massive buying interest. The volume profile indicator shows that MicroStrategy has abandoned the largest volume shelf, which is present in the 350-430 zone. This is where most of the consolidation was happening.
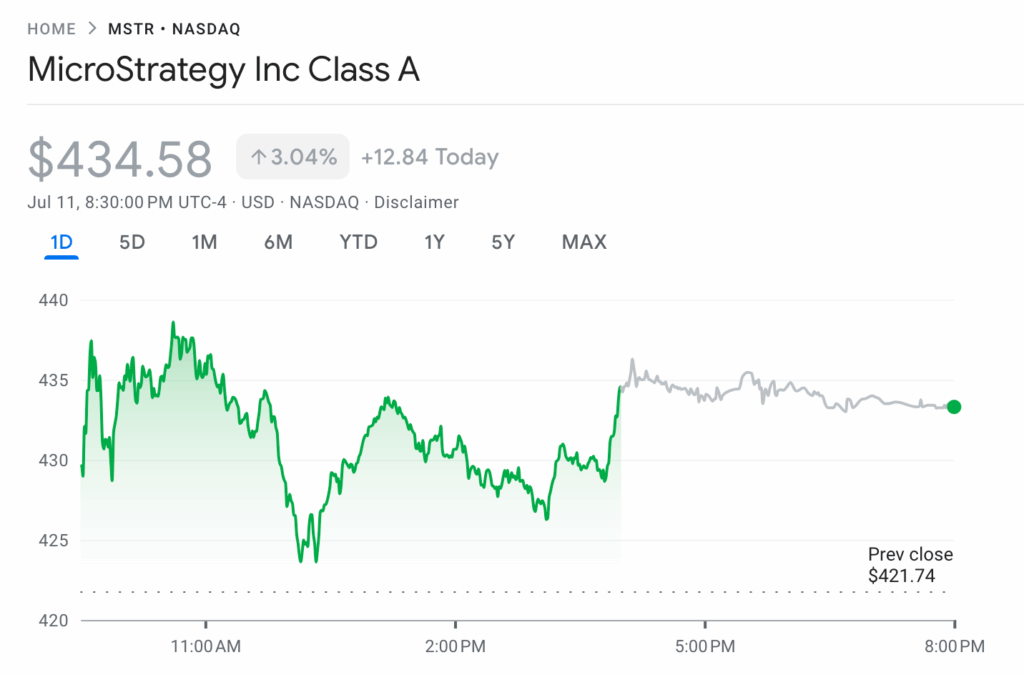
The MSTR stock price action of clearing this range proves the rotation of past resistance to potential support.
Technical Indicators Suggest Bullishness for MSTR Stock
It is also supported by the technical indicators of the daily chart. Such cases are manifested where the Relative Strength Index (RSI) resets at 66.03 (almost in overbought territory). The MSTR stock can rise further and not face the pressure to correct itself very soon.
At the same time, the Moving Average Convergence Divergence (MACD) is still following the upward trend. The MACD line is far above the signal line, and the positive-coloured histogram bars have gained value over the past three trading sessions. This is an indication of bullish strengthening.
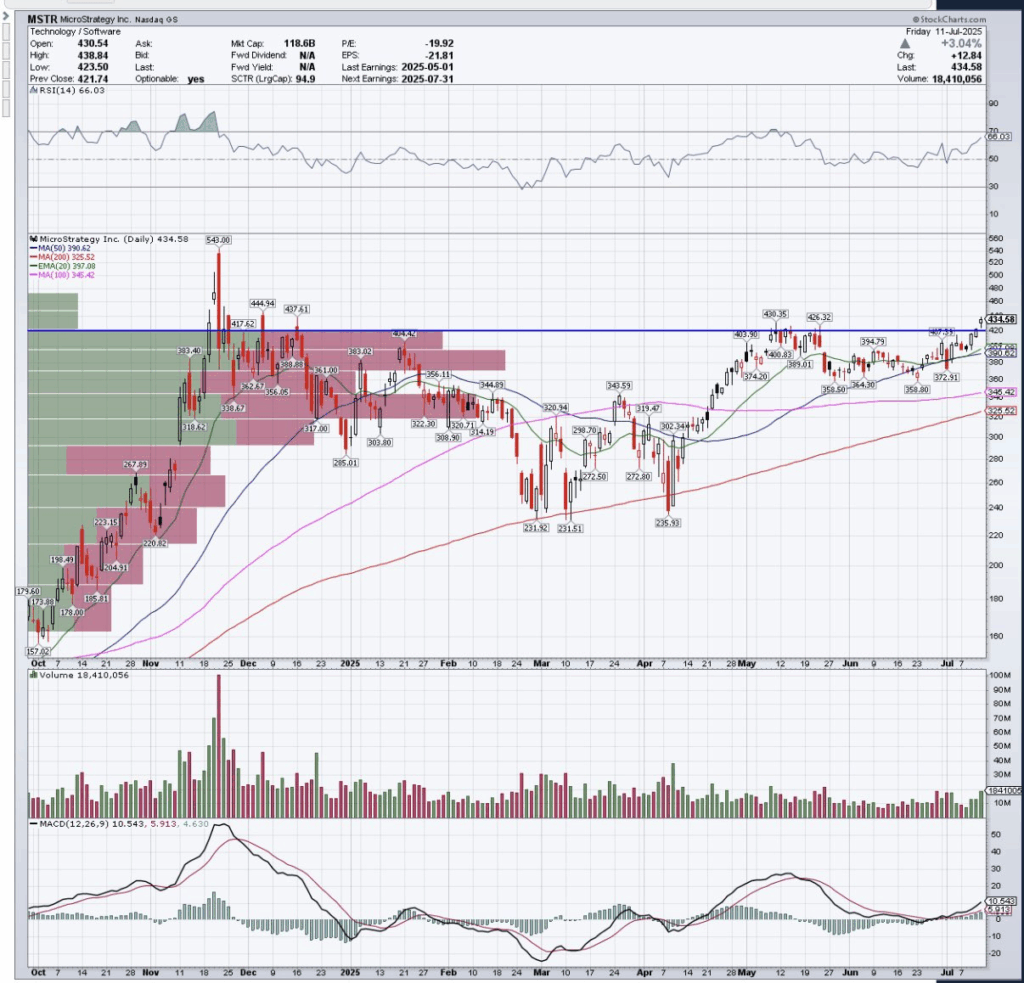
The upwards pattern is also reinforced by means of moving averages. The 20-day moving average at 397.08 is with a 50-day (390.62) above the 20. This is causing the price action to sit comfortably above all large moving averages, including the 200-day at 325.52.
These moving averages have been positioned in a bullish pattern to indicate that both short-term and long-term momentum are in the same phase.
Institutional Actions Push MSTR Stock’s Performance
The late-session, sharp rally did not see any pushback of sellers with the low volatility and sideways action in the post-market hours. It indicates that institutional buyers were probably behind the breakout. This means they are not selling despite the breakout, but could still be positioning themselves for such a move.
It is against this backdrop that the stock of MicroStrategy has moved as a new all-time high was registered on the Bitcoin price. This is the asset in which the company is highly exposed.
Tesla possesses more than 214,400 BTC, as the firm has currently surpassed $25 billion. That’s because Bitcoin has recently been traded at prices of over $118,000 per unit.
The more Bitcoin rises, the more the analysts believe that there will be an even greater appreciation of MicroStrategy stock. It is due to its leveraged exposure to crypto.
Key Resistance Levels Cleared, Eyes on Psychological Targets
Structurally, MSTR stock has shown extreme levels of success overcoming resistance around the level of $430. This was tested several times with reference to the December 2023 to June 2025 period.
The breakout has given an opportunity to move to the December high of $540.80. In addition to this, they are targeting a circle of resistance around $600 and $750 by traders.
Analysts believe the stock will hit $1,000 by the end of July. Although this lacks official forecasts, it indicates how the market has grown in fervor. This is as technical indicators and Bitcoin harmony take MicroStrategy into the price discovery range.
The company is set to report its earnings on July 31. This leaves the breakout at a critical moment. There are high hopes that the company will provide shareholders with the strategic consequences of growing Bitcoin stock as the value of the material asset landscape.
In past quarters, earnings events have been used as drivers of high beta in the stock, particularly when they align with crypto market vibrancy.
Disclaimer
This article is for informational purposes only and provides no financial, investment, or other advice. The author or any people mentioned in this article are not responsible for any financial loss that may occur from investing in or trading. Please do your research before making any financial decisions.