Bitway
 Pearl
Pearl Zylo Ecosystem
 Walrus
 Derive
 Pudgy Penguins
 Arbitrum

Key Insights:
- DOGE is breaking out of a symmetrical triangle on the 3-day chart, signaling a potential strong upside move.
- The triangle formed over 9 months, increasing the probability of a significant breakout if DOGE closes above $0.21.
- A reclaimed support near $0.22 may trigger a rally toward the $0.35–$0.38 liquidity zone, as per VegetaCrypto1’s chart.
Dogecoin (DOGE) price approached a critical technical zone as it consolidated within a long-standing symmetrical triangle. Analysts observed the possibility of a breakout, which may lead to a major rise. A close above $0.21 could be followed by an aggressive rally to higher resistance points, including $0.38.
Dogecoin Price Breakout Formation on 3-Day Chart
On the 3-day chart, Dogecoin price developed a symmetric triangle pattern, which suggests a major price shift can follow. The structure linked a sequence of lower highs and higher lows, which showed low fluctuations in the meme coin as the prices squeezed to reach the peak.
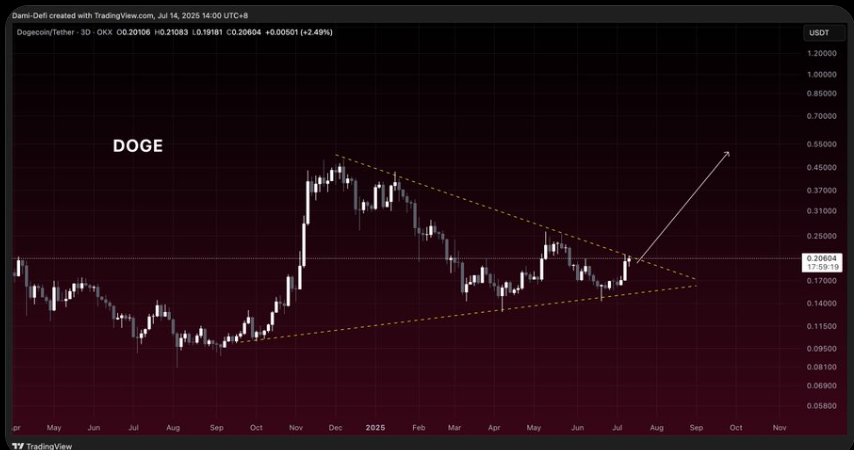
When writing, Dogecoin’s price was around $0.206, just above the triangle’s upper limit.
Besides, a symmetrical triangle is normally a sign that the market is undecided. However, when breached, it is likely to produce a directional move. An upper breakout trendline is typically established by a breakout with a close beyond the trendline.
In the DOGE case, this would happen when it closes above $0.21. When maintained, DOGE price can create a new trend, attracting momentum in both the spot and derivatives markets.
Nine-Month Pattern Support Bullish Momentum
More so, the triangle has been forming since late 2024, and is expected to the end of July 2025. This long compression phase qualified the possible breakout even more because a long squeeze tends to follow a sudden price movement. The longer the market consolidations, the more momentum it has built up to break out or break down.
In this case, the analyst noted the $0.21 resistance. An upside breakout beyond this point will confirm the absence of the lower high and may result in an upward movement.
Directional spikes on the historical DOGE chart have frequently followed previous triangle formations. The trading volume was not too high, and another significant buying pressure above $0.21 would further prove the technical formation.
Reclaiming $0.22 Could Open Path to $0.38
Meanwhile, analyst VegetaCrypto1 shared a Dogecoin price chart on X with a bullish correction. As per the chart, the next rally could start by reclaiming support around $0.22. The analyst suggested a possible price trajectory to reach the $0.35-$0.38 levels, where there is key resistance.
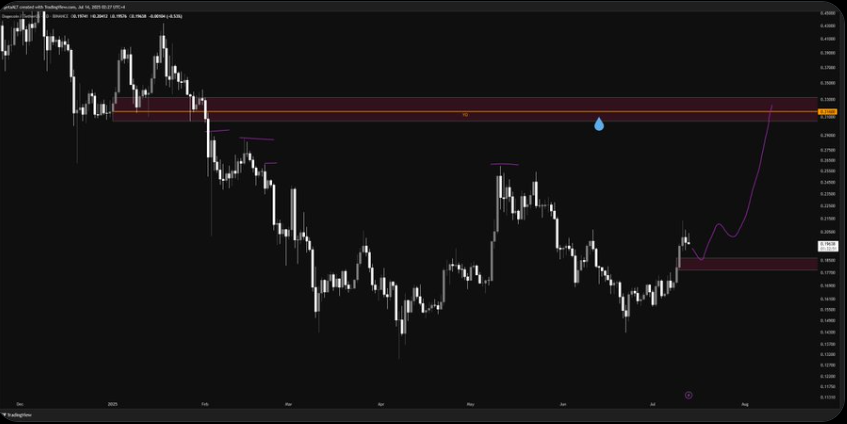
Furthermore, this target area was a previous level of support where DOGE previously experienced severe rejection earlier in 2024. The confluence of past supply and current structural recovery forms a technical magnet for price.
Traders trapped during the earlier downtrend may exit around that level, creating high liquidity. If Dogecoin’s price can be sustained above $0.22, this area may be revisited due to the lack of resistance between $0.24 and $0.34.
Historical Resistance Aligns With Liquidity Targets
Moreover, the $0.35–$0.38 area was a prior resistance zone and a potential liquidity cluster. Chart activity from early 2024 showed multiple rejections near this band, forming a supply wall. The price has not returned to this level since, leaving untested sell orders and stop-loss zones above.
Hence, these trapped positions, combined with increased open interest if DOGE begins to trend, can attract smart money toward that zone. If the price enters this region with sufficient volume, it may trigger a rally before consolidating again.
Disclaimer
This article is for informational purposes only and provides no financial, investment, or other advice. The author or any people mentioned in this article are not responsible for any financial loss that may occur from investing in or trading. Please do your research before making any financial decisions.