
 Zylo Ecosystem
 astronaut
 Pearl
Pearl Walrus
 Starknet
 Pudgy Penguins
 Bitcoin
Key Insights:
- Bitcoin holds above the $117,400 trendline support, signaling strength in the current consolidation phase.
- Analyst Ali Martinez projects a $131,200 target if Bitcoin maintains structure above key support zones.
- Bitcoin reclaimed the 0.618 Fibonacci level at $117,200, confirming bullish continuation toward $120,000.
Bitcoin price picked up bullish traction as analysts flagged two important levels that may help to sustain the current uptrend. BTC at the time of writing was trading above $119, 000, with indicators and structural formations in line with a possible movement to the $131, 200 target.
Bitcoin Price Prediction: Bullish Structure Emerges Above Key Support
Analyst Ali Martinez predicted that Bitcoin price could rise toward $131,200, provided the $117,400 support level remained valid. His latest analysis of the 4-hour BTC/USDT chart showed Bitcoin price trading above an ascending trendline since late June.
This trendline intersected with a recent consolidation zone and has held firm over several sessions.
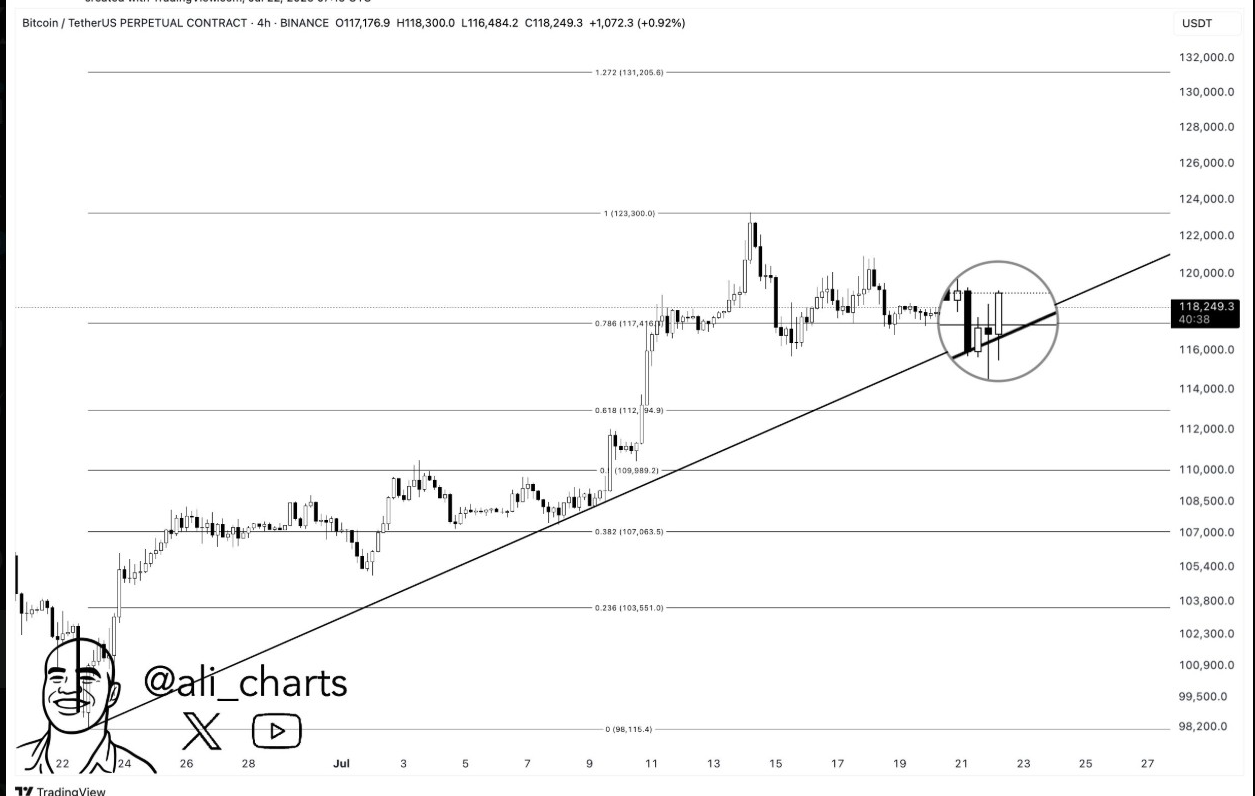
After a brief breakdown, the analyst’s chart further showed a reclaim of the 0.618 Fibonacci level near $117,200. This reclaim confirmed a bullish continuation and strengthened the zone’s support structure.
Bitcoin price continued to print higher lows while resisting sharp declines, suggesting buyer interest remains active. The upward grind toward $120,000 shows resilience despite temporary rejections.
Additionally, Martinez’s $131,200 target aligns with the 1.272 Fibonacci extension drawn from a previous BTC price surge. The target projection depends on the market’s ability to hold above the $117,400 trendline.
If the support fails, lower Fibonacci zones around $114,000 and $110,000 could come into focus. However, Bitcoin price structure above current levels still favors continuation toward the next resistance cluster near $124,000.
Multi-Year Megaphone Breakout Holds After Trendline Retest
In addition, Bitcoin price recently validated a breakout from a multi-year bullish megaphone structure. Analyst Mister Crypto noted that this pattern developed between 2019 and 2025. A breakout above the upper boundary was confirmed in early 2025, followed by a retest that turned former resistance into support.
During the retest, BTC price reclaimed the $100,000 zone and since then, it showed higher highs. The megaphone pattern reflected expanding volatility, often preceding directional moves when broken.
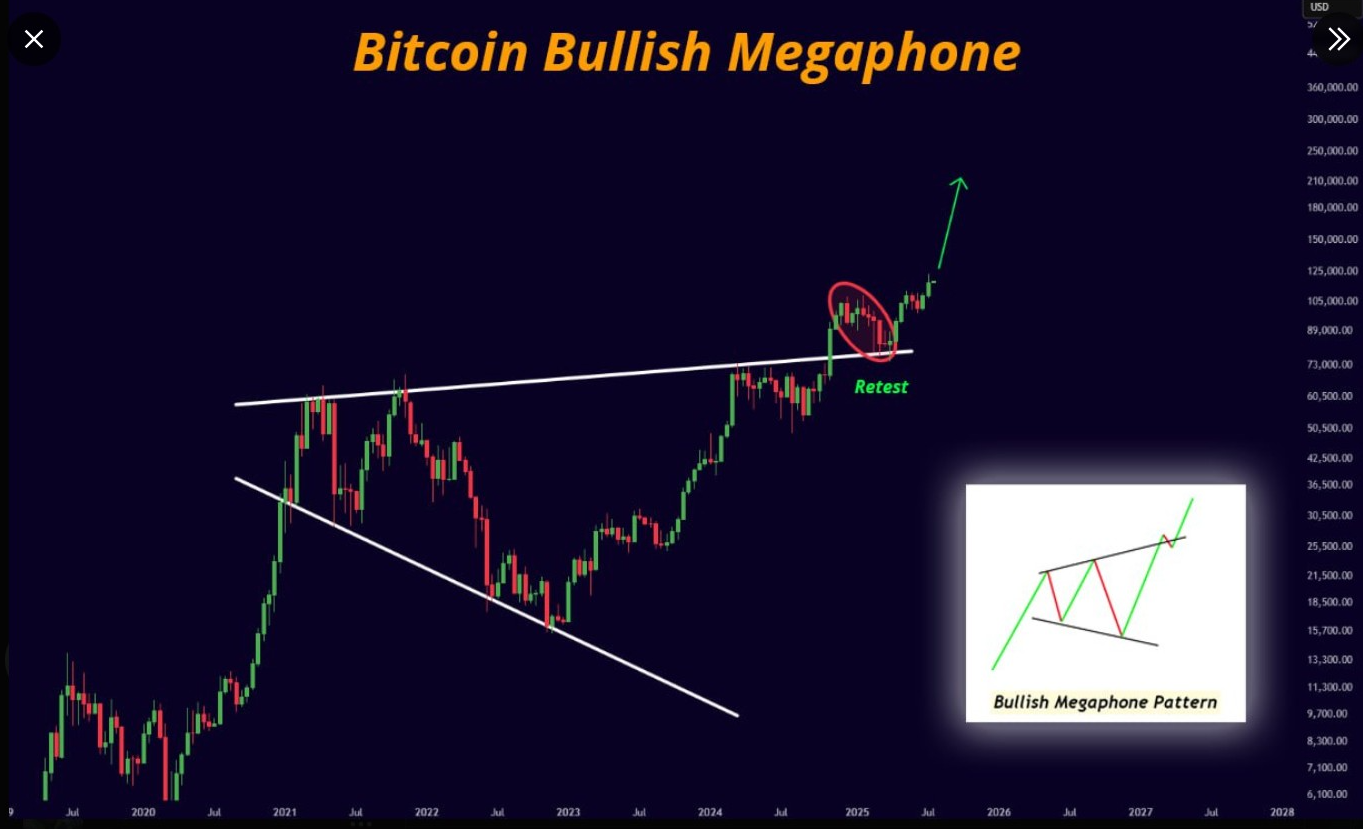
The successful retest of the upper boundary has reduced the chances of a failed breakout. Bitcoin now trades with a bullish structure intact, and rising demand levels reinforce the trend.
Open Interest Growth Supports Rally Continuation
Additionally, open interest in Bitcoin derivatives has grown steadily, reaching $99.62 billion. This growth has occurred alongside Bitcoin price recovery above the $100,000 level. Historical data shows that sharp spikes in open interest often lead to corrections. However, the current increase appears more gradual.
Rising open interest during an uptrend often reflected broader market participation. The steady nature of this rise may reduce the risk of abrupt liquidations.
Meanwhile, other Bitcoin price prediction models showed similar bullish structures forming across mid-term charts. Analysts highlighted a symmetrical triangle pointing toward a $125,000–$130,000 breakout, while another outlined a five-wave expansion suggesting a move beyond $160,000.
Short-Term Ranges Show Possible $140K Mid-Term Push
On the short-term chart, another analyst outlined a possible three-stage range movement. Bitcoin price is projected to rise toward $125,500, which aligns with the 1.272 Fibonacci extension. The chart included signs of accumulation within defined consolidation bands.
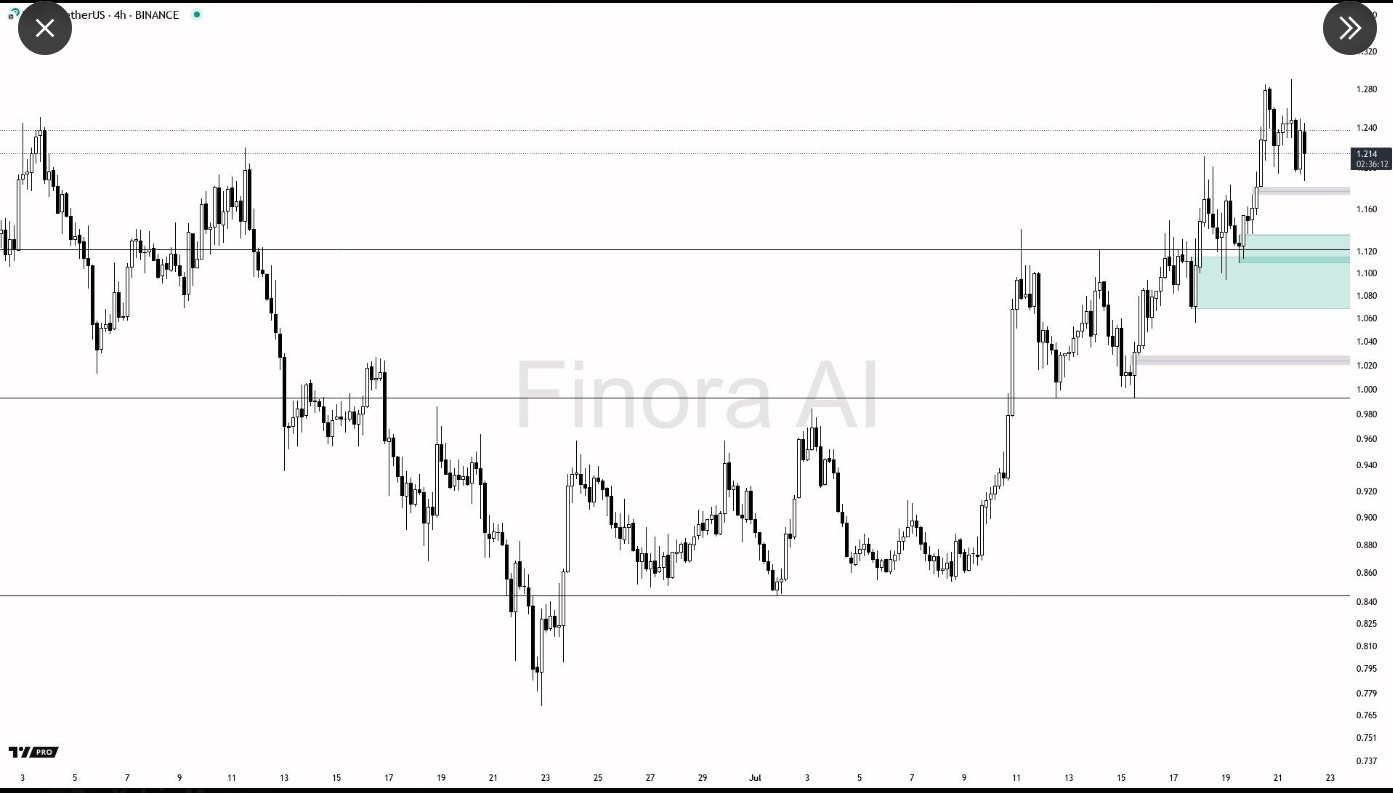
A pullback is expected after BTC reaches $125,500, targeting the $113,000–$114,000 zone. This level matches the 0.618 retracement and prior demand region. If that zone holds, a final move may carry Bitcoin toward the $140,000 zone within the medium term.
The setup reflected a structured range progression rather than a parabolic surge. This trend may allow traders to capitalize on short-term pullbacks in BTC prices.
Disclaimer
This article is for informational purposes only and provides no financial, investment, or other advice. The author or any people mentioned in this article are not responsible for any financial loss that may occur from investing in or trading. Please do your research before making any financial decisions.




