astronaut
 Pearl
Pearl NEAR Protocol
 Starknet
 Zcash
Zcash Pudgy Penguins
 Ethena

Solana price has crashed and moved into a local correction after falling by 13% from its highest point this month. This pullback could be brief, and as SOL has strong fundamentals, including the surging inflows into the recently launched staked ETF (SSK).
Solana Price Technical Analysis
The daily timeframe shows that the Solana price bottomed at $95.6 in April. It then started rebounding, eventually reaching a high of $205 this month. It recently moved above the upper side of the black symmetrical triangle pattern. That coincided with the 38.2% Fibonacci Retracement level.
Solana also formed a golden cross pattern as the 50-day and 200-day Exponential Moving Averages (EMAs) made a crossover. A golden cross is a common bullish continuation pattern implying a strong short-term trend.
The ongoing retreat is partly because of the ongoing weakness in the crypto industry. It is also happening after the token got highly overbought, with the Relative Strength Index (RSI) reaching 82. It is common for highly overbought assets to pull back as some investors start taking a profit.
Additionally, the ongoing pullback may be because it wants to retest the upper side of the triangle pattern. This performance is known as a break-and-retest pattern, a common continuation sign.
Most importantly, the token is in the third wave of the Elliot Wave pattern, which is normally the longest one.
Therefore, the most likely scenario is where it bounces back in the coming days. If this happens, the initial target price will be this month’s high of $205.
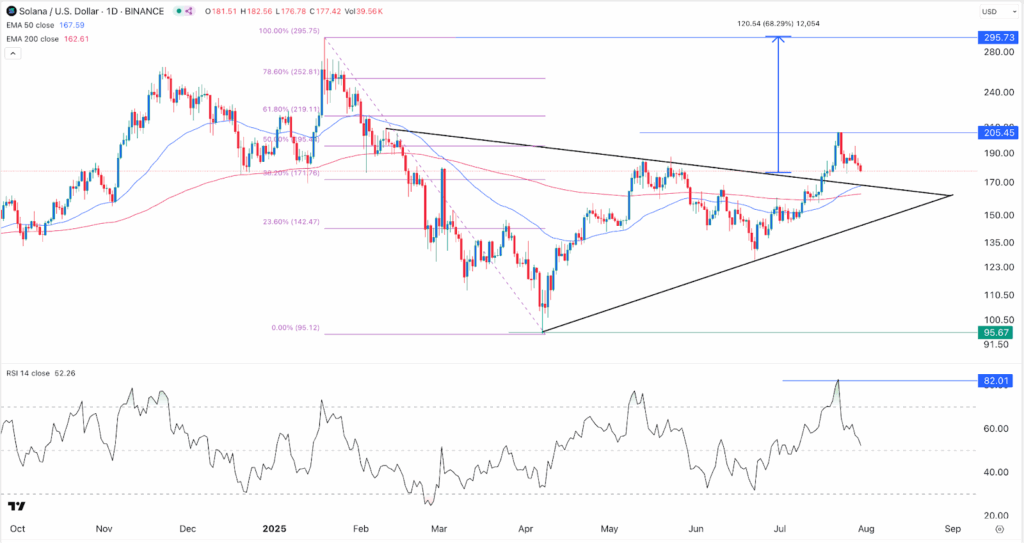
A break above that level will confirm the bullish breakout and point to more gains, potentially to the year-to-date high of $295, up by over 68% from the current level.
Staked Solana ETF is Gaining Momentum
One of the top catalysts that may push the Solana price higher is the ongoing demand for the recently launched REX-Osprey SOL + Staking ETF (SSK).
It is a unique ETF that allows American investors to benefit from SOL’s uptrend and its staking rewards. StakingRewards data shows that Solana has a staking yield of 7.47%. As such, the ETF’s yield is higher than other popular dividend funds.
Data shows that the SSK has had inflows in the last five consecutive weeks since its inception, a trend that may continue.
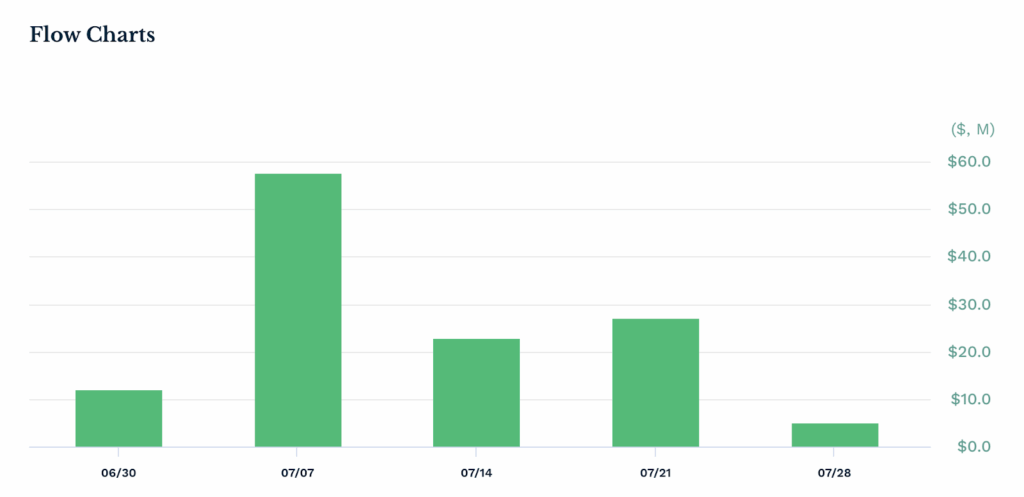
These inflows have brought its assets under management to over $137 million. This performance means that the other mainstream funds will receive substantial inflows from American investors.
Polymarket data shows that the odds that the SEC will approve spot SOL ETFs have jumped to over 80%. Such an approval will lead to more inflows as the SSK has demonstrated.
Recent data shows that there is an appetite for crypto ETFs this year. The cumulative Bitcoin ETF inflows have jumped to over $55 billion, with the iShares Bitcoin Trust (IBIT) having $87 billion in assets.
Similarly, the inflows into Ethereum ETFs stand at $9.62 billion and could cross the $10 billion milestone this week. BlackRock’s ETHA ETF has over $11 billion in assets.
The other top news that may drive Solana price is the ongoing transaction surge. Data shows that the network handled over 2.45 billion transactions in the last 30 days.
Can Solana Price Rebound to Its Year-to-Date High?
Solana price has pulled back in the past few days, coinciding with the ongoing crypto market pullback. This crash could be temporary as the altcoin still has some strong technicals and fundamentals.
Technically, SOL price has formed a golden cross and is about to retest the upper side of the symmetrical triangle. Fundamentally, Solana’s transactions have jumped by nearly 60% in the last 30 days, while the recently launched staked SSK ETF is seeing a lot of inflows from investors.
Solana is also in the third stage of the Elliot Wave pattern, which is usually the most bullish. Therefore, a rebound to its year-to-date high is still possible.