
 streamoors
 Sword Inu
 Altai the Tiger
 IGNITION
 no crying in the casino
 NEAR Protocol
 Pudgy Penguins
Key Insights:
- After sinking 28% from its all-time high, Hyperlink (HYPE) has formed a bullish inverted head and shoulders pattern on the four-hour chart, appearing near a key support level.
- Given the current market sentiment, a well-followed crypto expert shared a post on X, noting that the TD Sequential indicator is flashing a buy signal for HYPE.
- According to an on-chain tool, $37.52 is a key support level where traders have built $3.20 million worth of long positions.
Hyperliquid (HYPE) appears to end its downside streak, as bullish price action appears in the HYPE four-hour chart. This reversal sign in the asset appears after it fell 28% from its all-time high, which was recorded in the past month July 2025.
Hyperliquid Price Momentum and Expert View
At press time, HYPE is priced at $38.48, reflecting a 1.85% gain over the past 24 hours. Despite the price reversal signal, investor and trader participation remains lower than the previous day. CoinMarketCap data reveals that HYPE’s 24-hour trading volume has dropped by 45%.
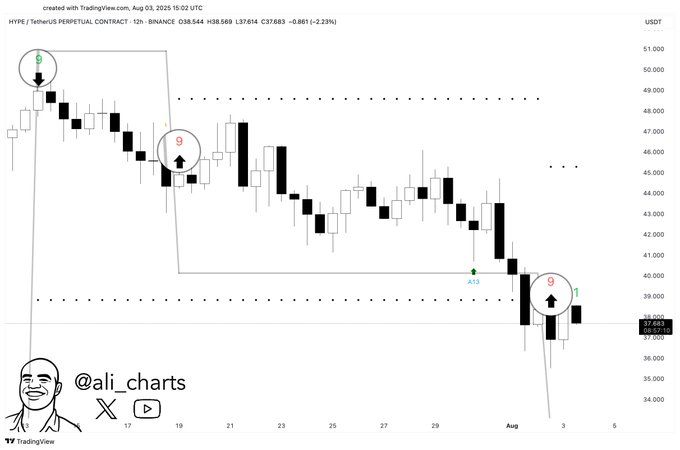
Given the current market sentiment, a well-followed crypto expert shared a post on X (Formerly Twitter) that Hyperliquid’s HYPE is flashing a buy signal. This buy signal was revealed by a technical indicator, TD Sequential, on the 12-hour chart. The expert continued by noting this could be the start of a price rebound.
Hyperliquid (HYPE) Price Action and Key Support Levels
According to expert technical analysis, Hyperliquid (HYPE) appears bullish and is poised for a strong price reversal. On a four-hour chart, the asset has formed a bullish inverted head-and-shoulder pattern and is on the verge of a breakout.
This formation of bullish price action has been found on a key support level of $35.70.
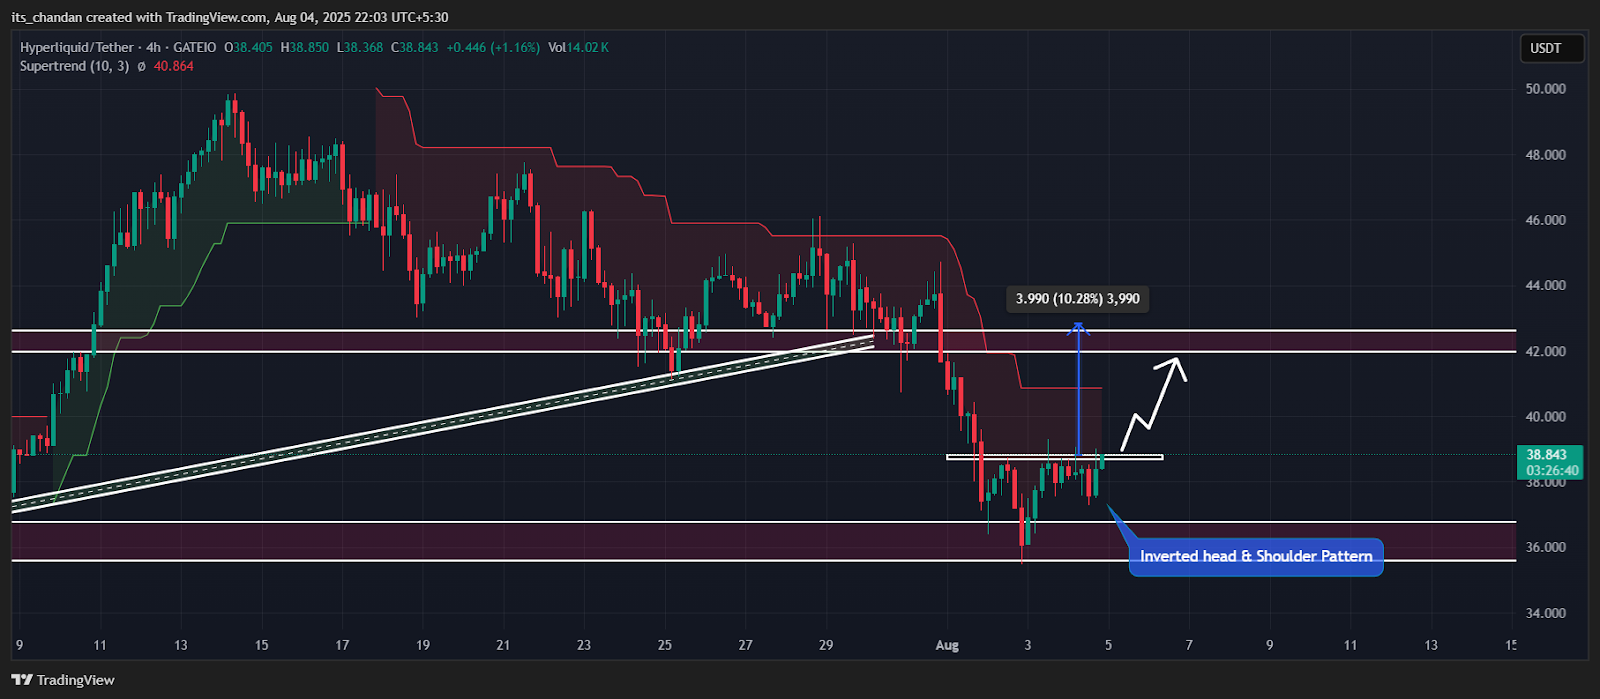
Based on recent price action and historical patterns, the HYPE price could only soar if the four-hour candle closes above the $39 level. If this happens, the asset could soar by 10% and the price may reach the $42.60 level in the future.
Despite this bullish outlook, Supertrend is found above the HYPE price and is red on the four-hour time frame. This suggests that the asset is in a downtrend and sellers are dominating.
Whereas, on an hourly time frame, this indicator is found below the HYPE price and green, suggesting the asset is in an uptrend.
This mixed signal from Supertrend hints that the asset is in a transition phase, either trying to reverse trend or forming a temporary bounce within a larger downtrend.
Bullish On-Chain Metrics
Given the current market sentiment, it appears that investors are strongly accumulating the token. According to the on-chain analytics firm Coinglass, exchanges have witnessed. An outflow of $502k worth of HYPE tokens in the past 24 hours.
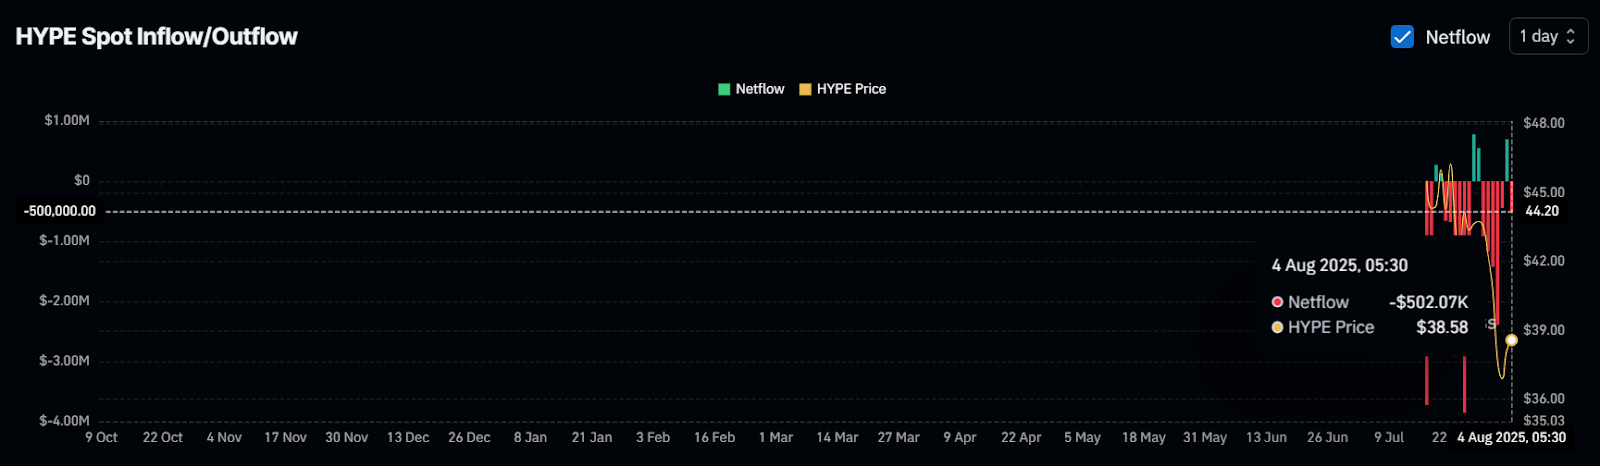
This substantial outflow of tokens from exchanges hints at potential accumulation and can cause buying pressure and an upside rally.
Not only investors but traders are also following the same trend. According to the exchange liquidation map, HYPE’s major liquidation levels are $36.85 on the lower side and $39.10 on the upper side.
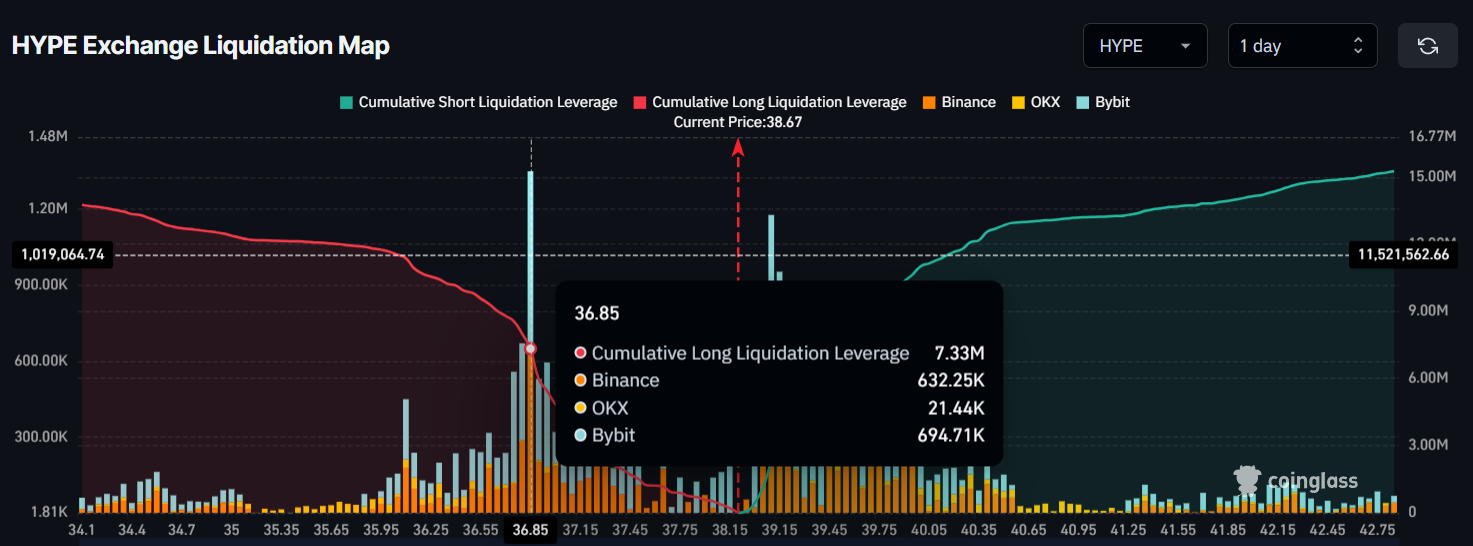
At these levels, traders are over-leveraged, with $7.33 million worth of long positions and $2.29 million worth of short positions. However, the $2.29 million in short positions are on the verge of liquidation. And could be triggered if the asset crosses the upper level.
Considering these metrics, it appears that bulls are currently in control and pushing the asset upward.
Disclaimer
This article is for informational purposes only and provides no financial, investment, or other advice. The author or any people mentioned in this article are not responsible for any financial loss. That may occur from investing in or trading. Please do your research before making any financial decisions.




