NEAR Protocol
 Bitcoin
 Aerodrome Finance
 Pearl
Pearl Uniswap
 Quantus
 Pudgy Penguins

Key Insights:
- CME Economic Research reported that XRP showed weaker correlations to other crypto assets than BTC, ETH, and SOL.
- XRP price action chart looked like 2017. However, it moved more slowly with support at $2.81 per the cost basis distribution.
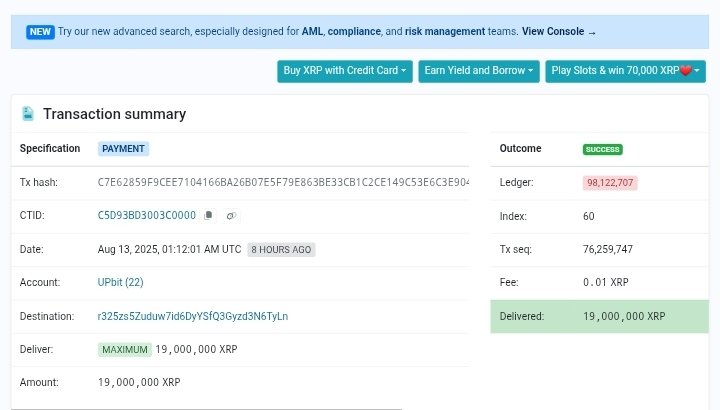
- A whale grabbed 19 Million XRP, worth $61M in one transaction on Upbit exchange.
XRP Price replicates previous chart patterns, but CME Group noted otherwise for the altcoin. Despite CME’s report being negative, XRP appeared 10th among coins with huge gains.
XRP had gained 48.5% for the year-to-date but was down about 6.9% for the past one week. The altcoin was trading above $3 when writing, with daily volume at $4 Billion, a 40% decline. The market cap stood at $184.6 Billion; only BTC and ETH had a higher value.
XRP was strong in the payment sector systems. Recently, the XRP Ledger was deployed by big pharmacies to speed up transaction speed during payment. This was made possible by a Nasdaq-listed, Pharma Distributor, handling more than 6,500 pharmacies.
CME Group Report on XRP Price Weakness Against Other Cryptos
Per a report by CME Group Economic Research, the XRP price showed weakness compared to other top-capped cryptocurrencies. The correlations were gauged on a one-year daily return against Bitcoin, Ethereum, and Solana.
The three graphs have declined since the beginning of the year. However, since the end of the first quarter, the pairs have been taking a turn to the upside. The turn has not been as robust as the hype in XRP, especially after recent adoption talks in the U.S.
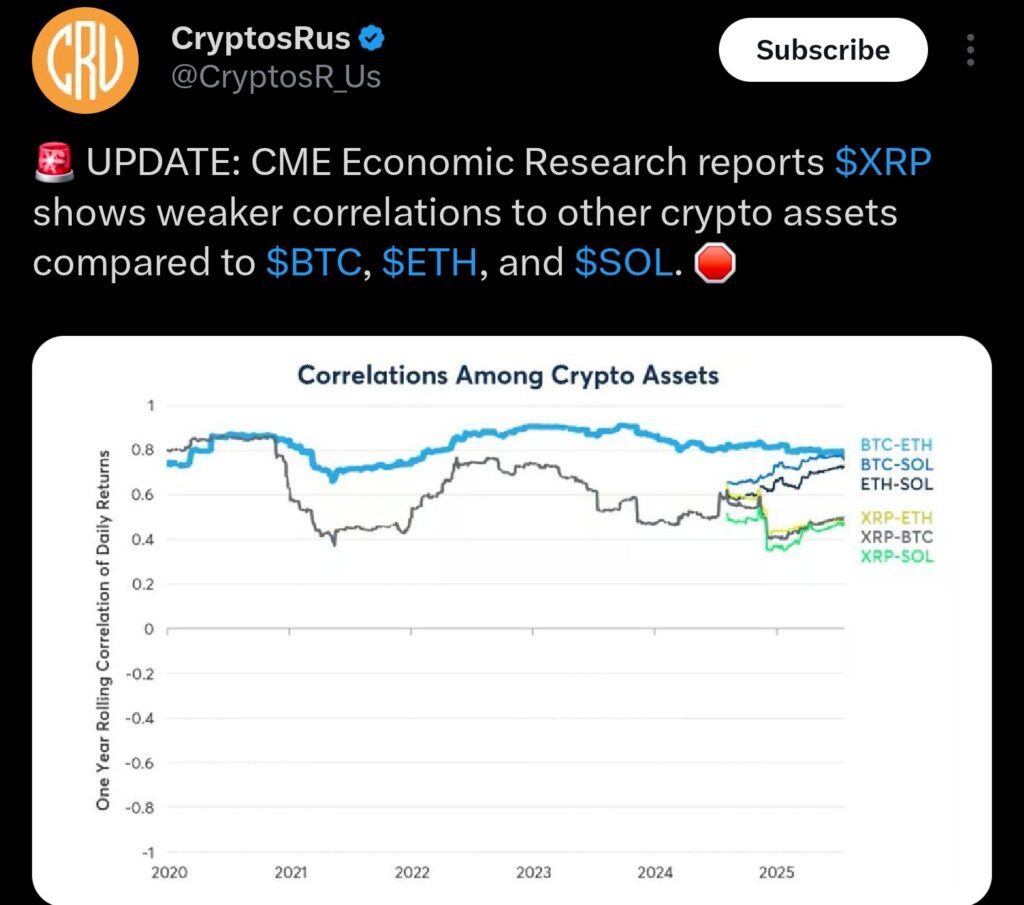
The underperformance of XRP Price compared to its peers may signal reduced investor confidence. This could pressure its price downward. If this trend continues, traders might rotate into more substantial assets, amplifying the impact.
XRP Price Mirrors 2017 Pattern, But Slower
The weekly XRP price chart resembled the 2017 rally. On the downside, the current pattern was not as robust as then.
GalaxyBTC noted on X (formerly Twitter), “XRP looks like 2017 but moving at a slower pace.” The analyst added that it took three attempts to go parabolic earlier. Now, the price action was in its second attempt.
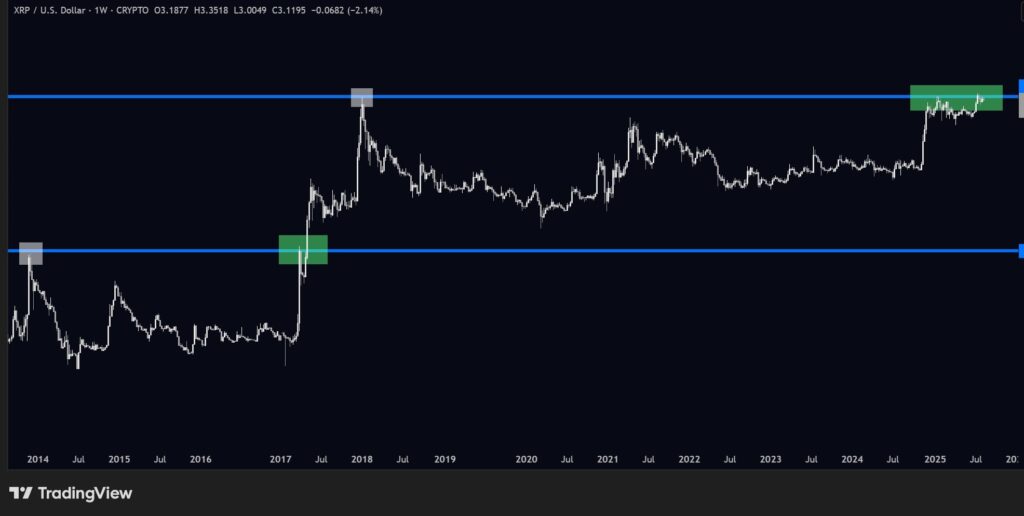
As per the analysis, there were minimal new buyers compared to old ones. This could be the reason why XRP was having it in slow motion.
A sustained stay above $3.12 level could push XRP price into $5 zone and eventually $10. However, when and how was unclear. Still on key price points, the cost basis distribution heatmap stipulated critical zones to watch per Ali Charts on X.
Approximately 1.70 billion XRP amassed at $2.80 zone formed a strong floor. On the other hand, 1.04 billion at $3.20 formed a resistance that hindered advances past the $3.12 mark.
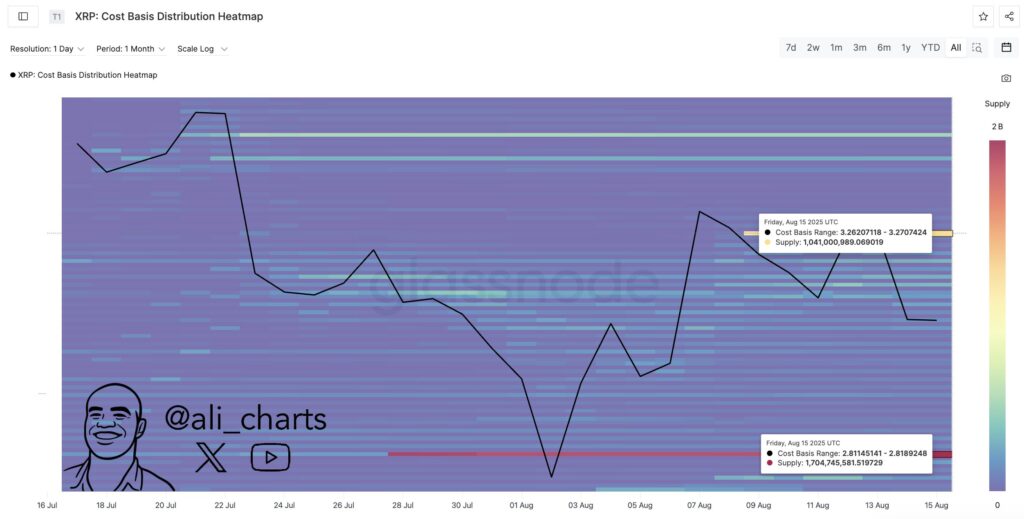
XRP could revisit this $2.81 zone to pick up more liquidity. Recent analysis by Ali Charts pointed toward a correction but seemed far-reaching. This is due to the altcoin’s resilience around the $3 zone.
XRP News: Whale Scoops 19M Tokens In A Single Move
While small traders are always late to the party, whales accumulate during periods of highest uncertainty. A whale longed for more than 19 million XRP tokens valued at $61 Million in a single transaction. The transaction came after a struggling price action in the previous week.
Still, the retail FOMO was subdued. A signal that now could be an opportune time to load more while keeping risk management in check. The social volume was in a downward spiral. This suggests that the altcoin received less attention than peers like BTC and ETH.
In conclusion, CME Group noted weakness in XRP. This was reflected in the slow XRP price action. Meanwhile, as it is the norm for whales, accumulation was at its best..
Disclaimer
This article is for informational purposes only and provides no financial, investment, or other advice. The author or any people mentioned in this article are not responsible for any financial loss that may occur from investing in or trading. Please do your research before making any financial decisions.