no crying in the casino
 Pyth Network
 NEAR Protocol
 Starknet
 Quantus
 Pearl
Pearl Bitcoin

Key Insights:
- Jerome Powell’s Jackson Hole speech on Friday could cause a crypto rally
- Bitcoin dominance approaches critical break below the 20-month moving average
- Ethereum and altcoins position for potential breakout from multi-year patterns
Crypto could detonate on Friday, according to analyst Dan Gambardello’s analysis of three key factors.
Jerome Powell’s Jackson Hole speech may signal dovish Fed policy shift favoring rate cuts. Bitcoin dominance sits near crucial support and Ethereum completes a multi-year triangle breakout.
Jerome Powell’s Jackson Hole Speech Could Cause Dovish Pivot
Friday will witness Jerome Powell’s Jackson Hole speech which historically moves cryptocurrency markets during major policy shifts.
The Fed Chairman’s previous dovish lean at the 2023 Jackson Hole event caused a 15% Bitcoin rally within one month. That speech also marked the official exit from the altcoin bear market, according to Gambardello’s analysis.
The 2023 dovish speech contrasts sharply with Jackson Hole 2022 when Powell’s hawkish stance coincided with crypto bear market territory.
Altcoin market cap charts show the August 2022 period marked continued downward pressure before eventual capitulation.
Gambardello expects Powell to hint that softening economic data prepares the Fed for September rate cuts. The speech serves as the Fed’s stage to greenlight monetary policy easing after months of restrictive conditions quietly.
A dovish lean could spark a 10-20% crypto rally within days according to the analyst’s projections. This initial move would cause a longer-term bullish cycle rather than just short-term volatility.
Bitcoin Dominance Nears Break Below 20-Month Moving Average
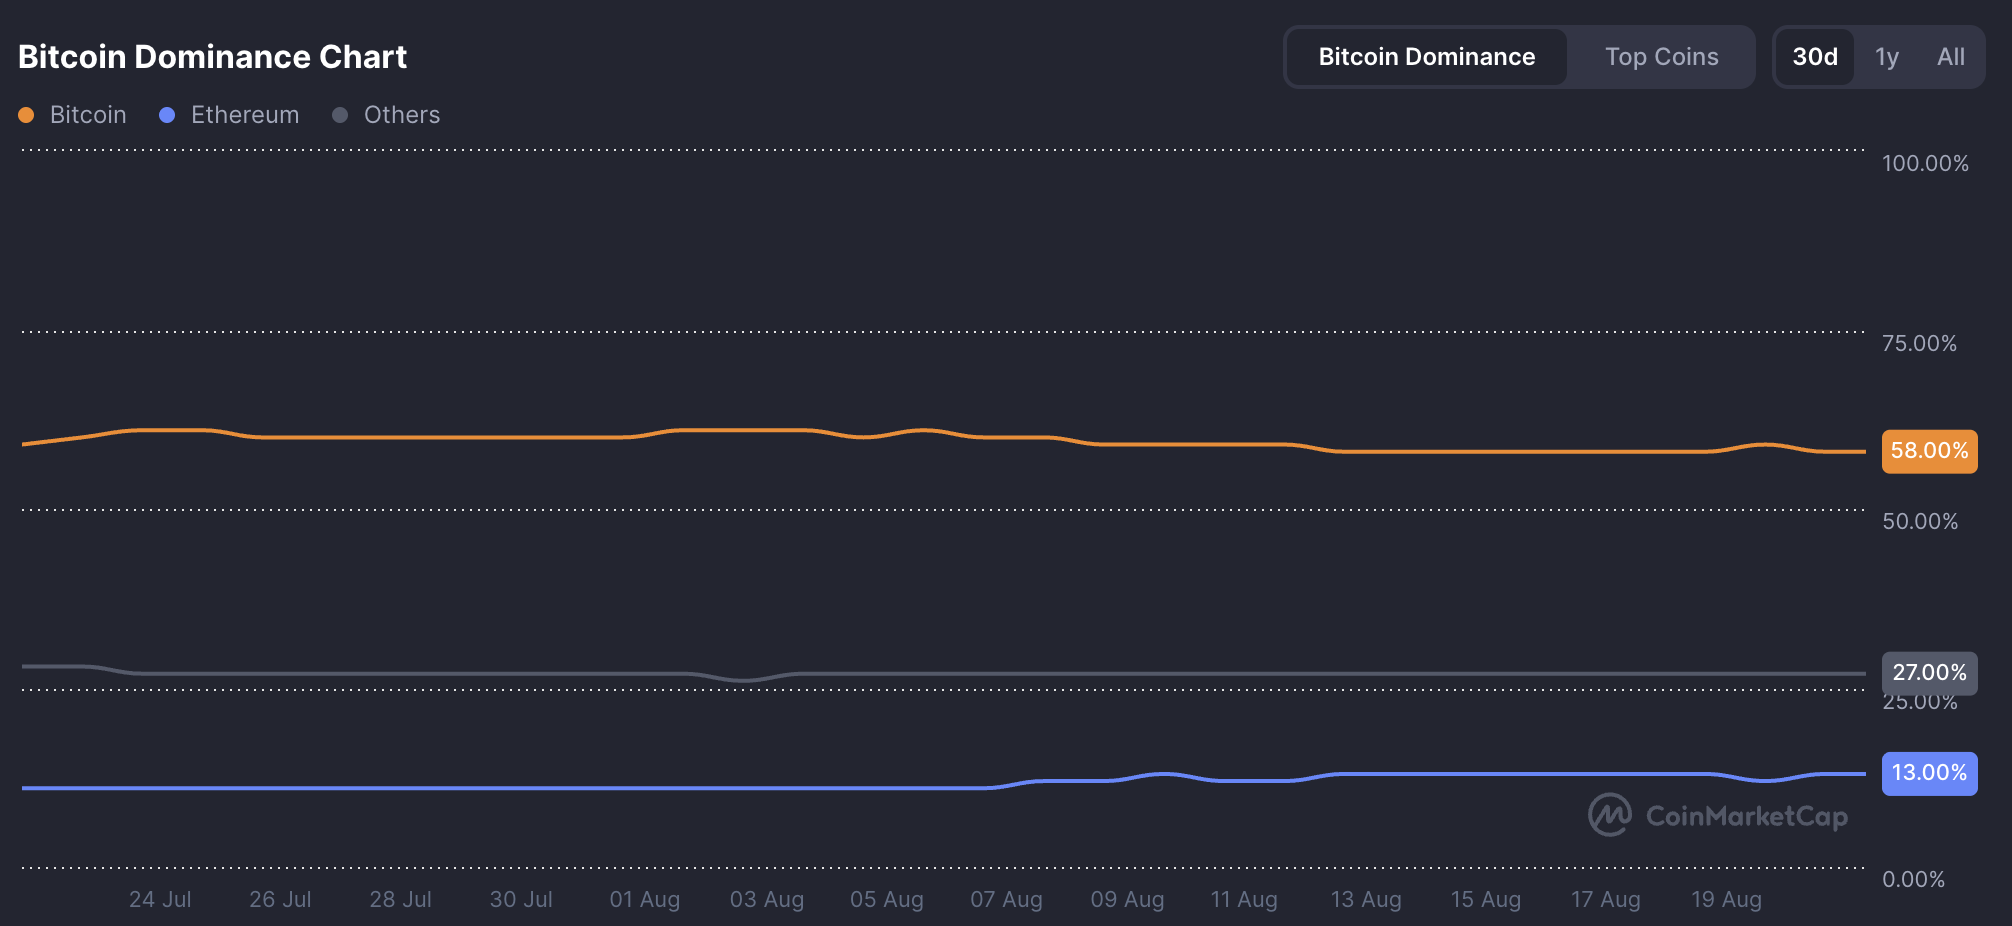
Bitcoin dominance currently trades around 58.5% approaching a technical level at the 20-month moving average.
A monthly close below this support would need approximately a 1.5% move down from current levels. This break could happen quickly if altcoins begin outperforming Bitcoin in the near term.
The MACD indicator on Bitcoin dominance shows the main line preparing to cross below the signal line.
This crossover hasn’t occurred since the beginning of the last altcoin season creating bullish conditions for altcoins.
Historical patterns show similar MACD crossovers preceded major altcoin rallies in previous cycles. When the MACD line crossed above the signal line during earlier periods, Bitcoin dominance initially moved higher before eventually breaking down.
Gambardello warns that even bullish technical breaks can experience throwbacks before continuing in the intended direction.
He also added that monthly closes below the 20-month average would provide stronger confirmation than intraday breaks.
Ethereum Triangle Breakout Positions Altcoins For Rally
Ethereum completed a multi-year triangle pattern breakout similar to Bitcoin’s earlier inverse head and shoulders formation.
This development mirrors Bitcoin’s successful pattern completion, leading to all-time highs and sustained bull market conditions.
Ethereum now begins its own structured breakout phase after years of consolidation.
The triangle pattern is a busted formation that initially broke lower before reversing to the upside as per Gambardello.
This type of failed breakdown often produces stronger rallies once the reversal occurs. Ethereum’s breakout positions the cryptocurrency for potential price discovery above previous resistance levels.
Gambardello notes that Ethereum could experience throwback volatility similar to Bitcoin’s neckline retest after its pattern completion.
This normal technical behavior might create short-term choppiness before sustained upward movement begins. Potential pullbacks toward the triangle apex around $3,000 remain possible without invalidating the bullish structure.
Ethereum’s risk model currently sits at 54 which historically marks pre-bull market territory.
Previous cycles show this level was followed by major rallies when combined with technical breakouts.
The risk score has tested resistance around 60 multiple times before falling back and is a key level to monitor.
Institutional buying supports the technical setup with Tom Lee’s Bitmine purchasing 52,476 Ethereum worth $220 million during recent weakness.
Disclaimer
This article is for informational purposes only and provides no financial, investment, or other advice. The author or any people mentioned in this article are not responsible for any financial loss that may occur from investing in or trading. Please do your research before making any financial decisions.