
 Pearl
Pearl Bitway
 Zcash
Zcash Walrus
 Aerodrome Finance
 Starknet
 NEAR Protocol
Key Insights:
- Bitcoin price is testing crucial support levels around $112,000 currently.
- Volatility persists between $108,000 and $115,000 in recent days.
- A breakout above $114,000 could lead to higher price levels.
Bitcoin price is facing a stern test on a key support level. The trend has witnessed significant volatility that has recently seen the price range between $108,000 and $115,000.
Bitcoin Price Test of Key Support at $112,000
The Bitcoin price is in a close resting position at the support of $112,000, where it has been important over the past trading periods. A protracted decline below this threshold will trigger further downtrend, and another point at which it may create downward pressure is the level of $108,000.
On the contrary, should the price maintain its position above $112,000 and begin to reverse, there is a chance that Bitcoin may start to re-test the higher ranges.
The Bitcoin price is probing key support at $112,000, and a break will push it to $108,000. This quote shows the value of the level of prices around the 112,000-mark as a psychological and technical indicator.
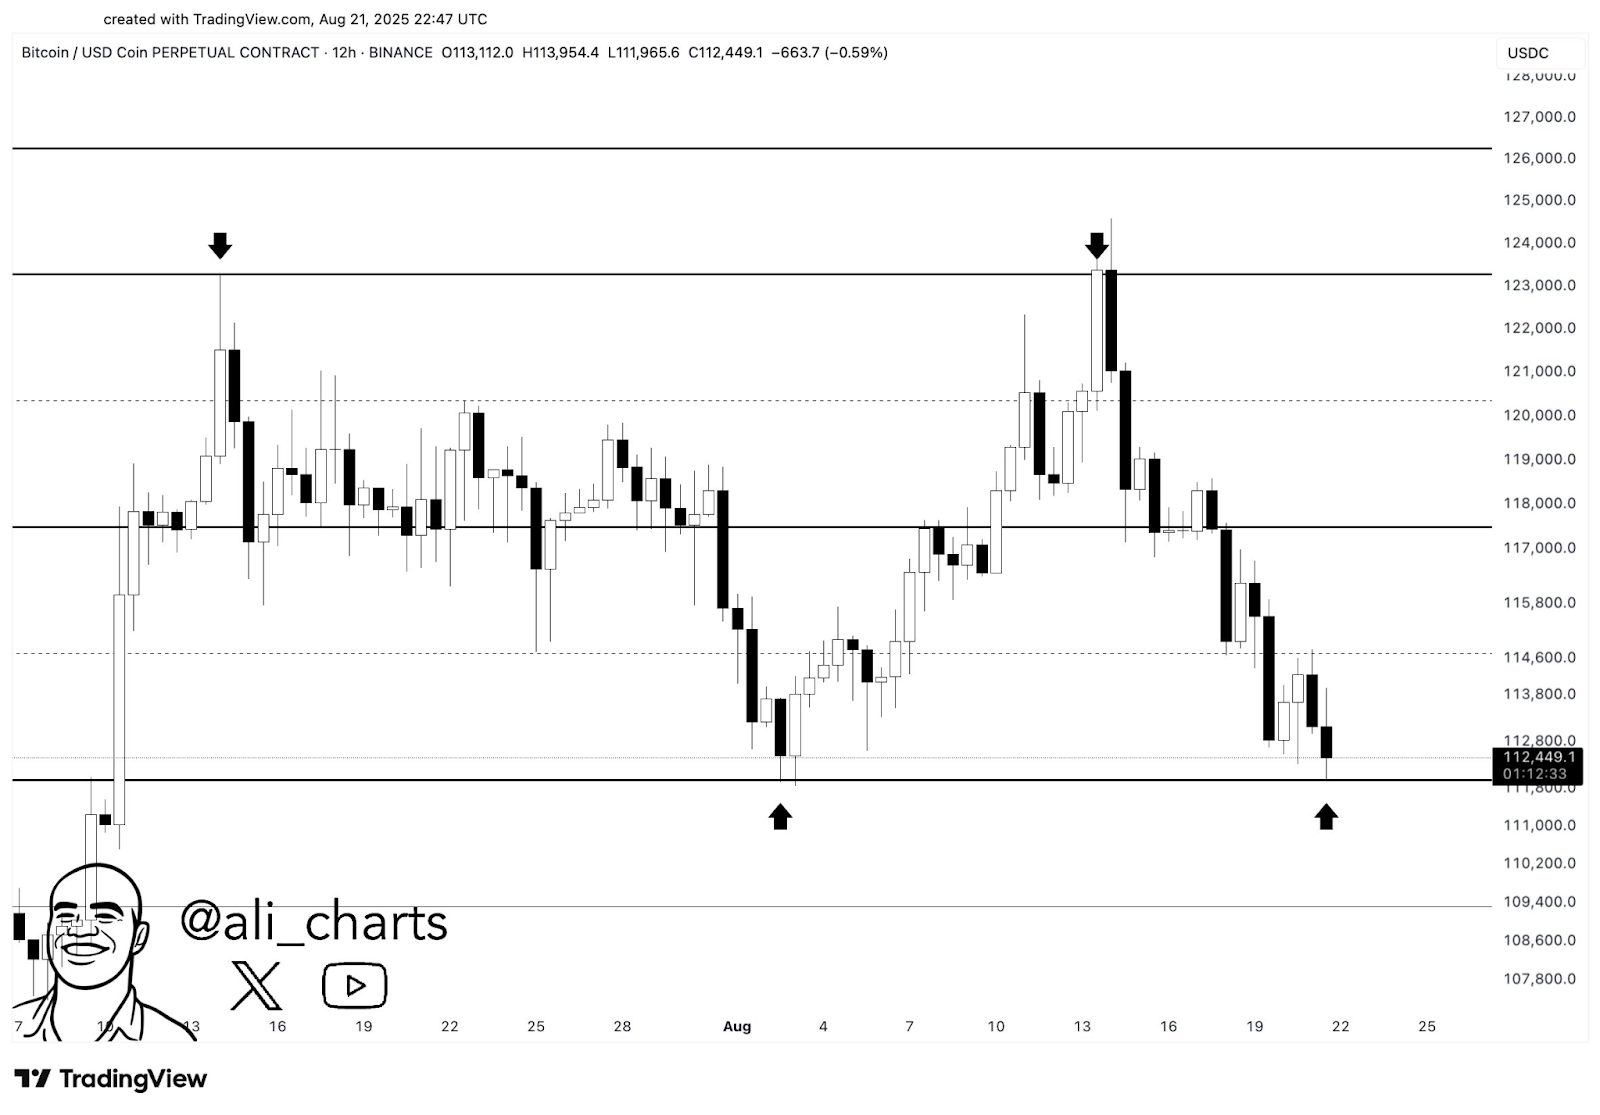
Due to Bitcoin failing to build stronger rallies above $115,000 recently, the level has become a hotbed of activity as traders both long and short the pair.
Bitcoin has been extremely volatile. The price has been hovering around these levels over the last couple of weeks as the market has not taken a clear direction yet.
On the chart, we can note that Bitcoin twice tried to break through the upper limit of the range of $115,000, but both times it was rejected. This saw it fal to the lower support level around 112,000 or 108,000.
Such price action points to the fact that Bitcoin is experiencing consolidation, and as traders await the next direction, they are uncertain about which direction the price could go next. Big fluctuations in the price within this range point to great uncertainty in the market. Traders are currently awaiting a breakout in both directions to give them validity on the next potential trend.
Bitcoin Price Forms a Falling Wedge Pattern
Among the most notable chart patterns worth highlighting in the recent Bitcoin price action on the cryptocurrency is the development of a falling wedge on a 1-hour chart.
A falling wedge pattern will generally indicate a possible reversal. Although this pattern indicates a bearish movement in the short term, it is also the signal of the price rise to follow in many cases when the price breaks the upper trendline.
A close breakout of $114,000 is likely to indicate the end of the bearish momentum and that buyers have taken control.
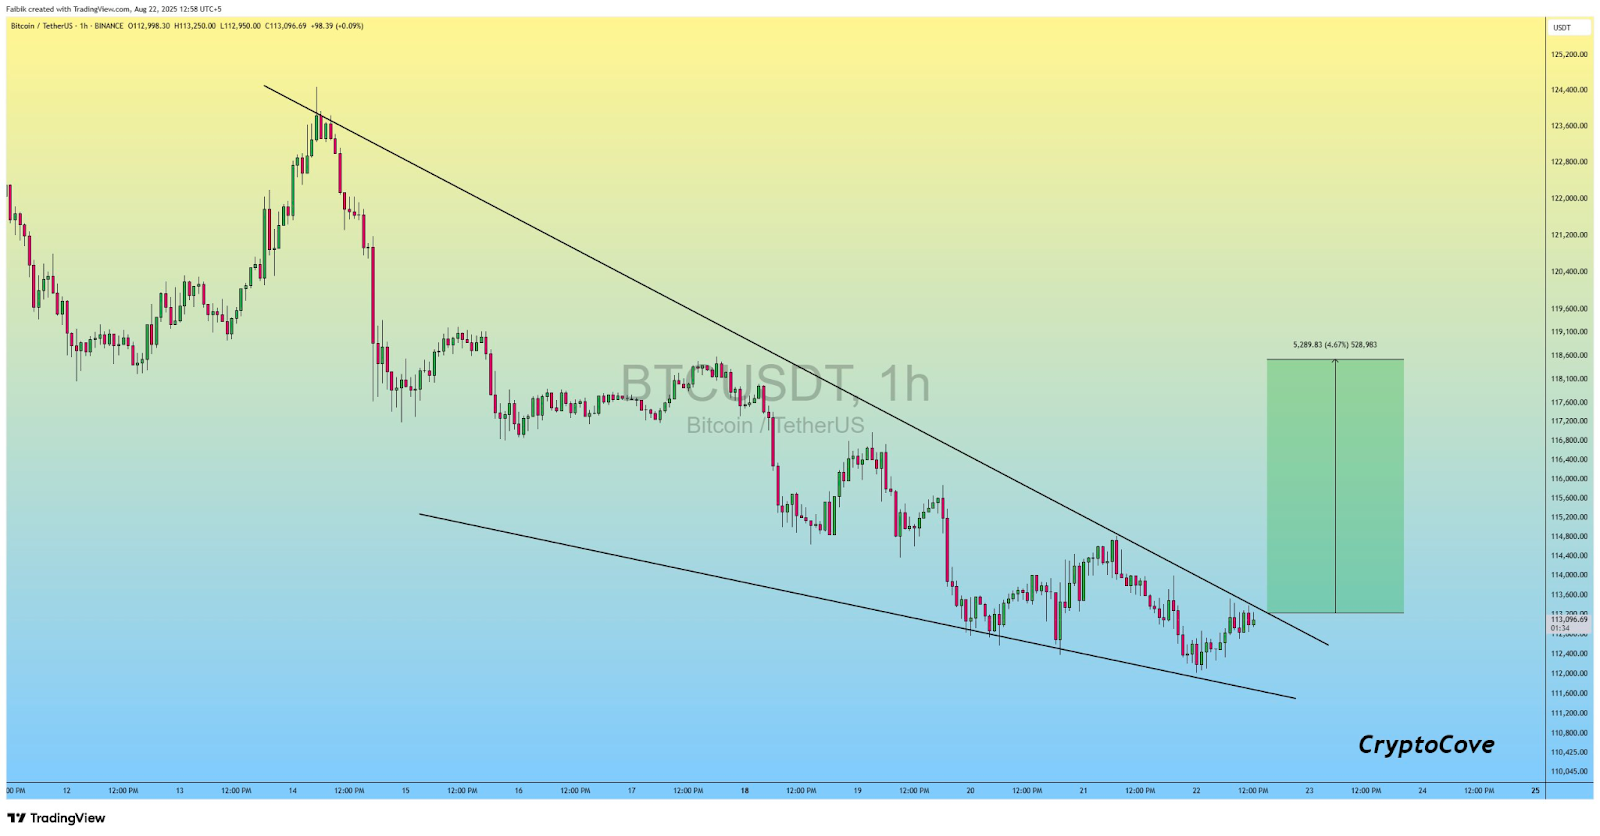
Taking into consideration the chart, it is possible to expect that there is an approach to the top of the wedge and the breakout may occur shortly. Provided Bitcoin breaks above the price of 114,000, the following major resistance areas can be observed at 117,000 and 118,000.
Market Sentiment and Liquidations Data
BTC total liquidations, the chart indicates that, in recent times of fluctuation, there were relatively high short liquidations, especially at prices of $112,000 and $108,000.
This implies that traders who have taken short positions have been taken by surprise by the price gestures in the last few days.
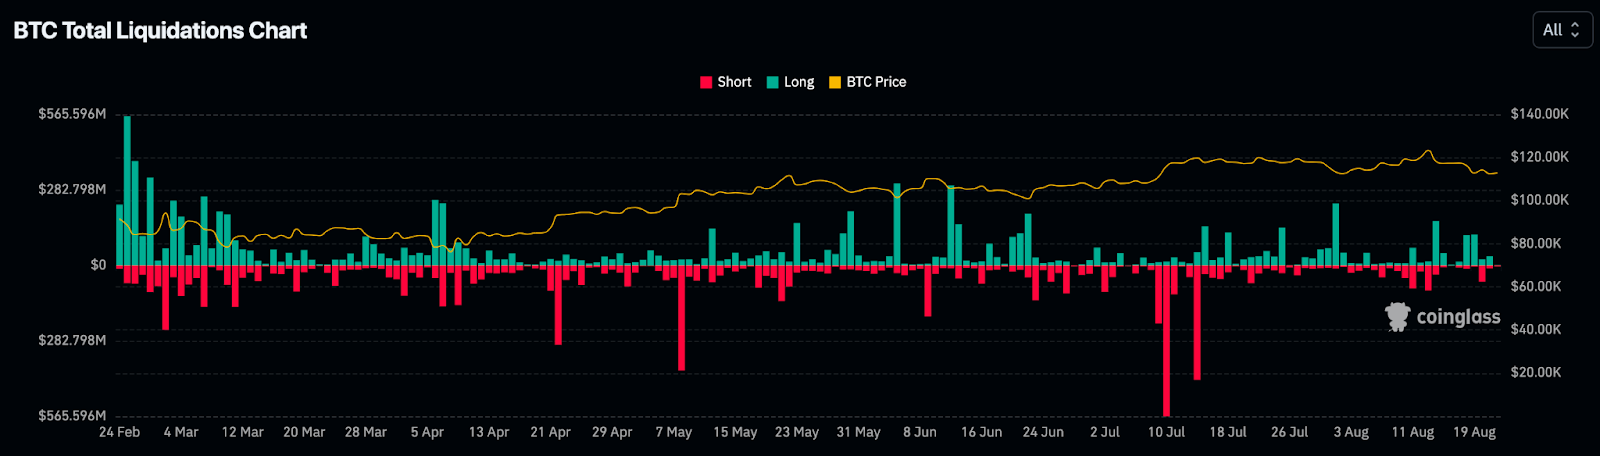
A liquidation frenzy usually causes a rapid swing in prices as various traders rush to liquidate a position, leading to a buying and selling pressure. This might be a huge factor in whether the Bitcoin price reaches $200,000.
Disclaimer
This article is for informational purposes only and provides no financial, investment, or other advice. The author or any people mentioned in this article are not responsible for any financial loss that may occur from investing in or trading. Please do your research before making any financial decisions.



