
 NEAR Protocol
 Pearl
Pearl Bitcoin
 Puffer
 ZKsync
 Pudgy Penguins
 Hyperliquid

Dogecoin price is approaching a pivotal price level after weeks of sideways trading. Technical patterns across different timeframes indicate rising bullish momentum. Analysts suggested a breakout could push DOGE price sharply higher toward $0.30 and beyond.
DOGE Price Nears Breakout Zone Above $0.23
Analyst Ali highlighted that Dogecoin price is testing the upper boundary of a symmetrical triangle. His chart suggested that a clear break above the $0.23 mark is a possibility that sharp gains may follow.
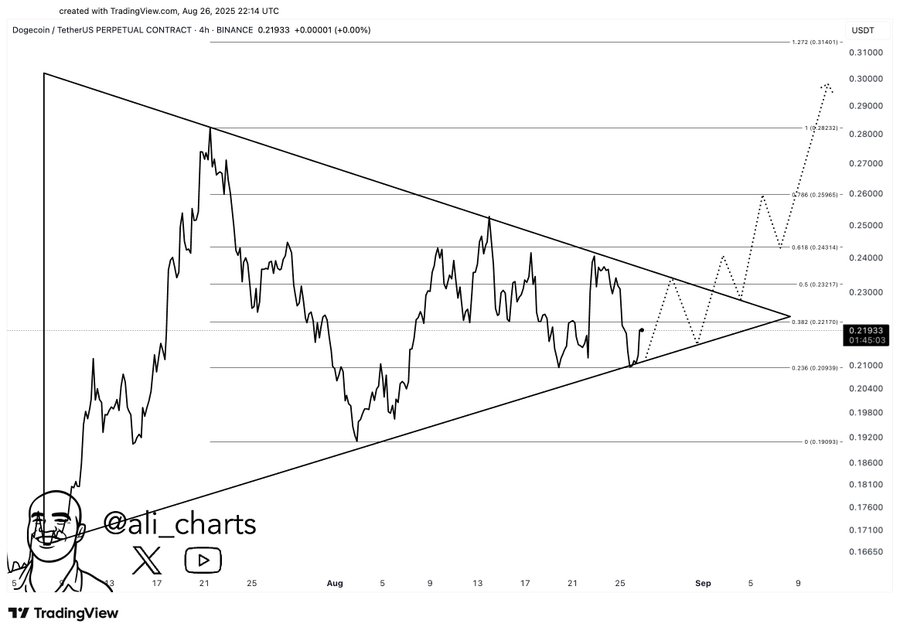
He identified the Fibonacci extension targets, setting the next resistance at around $0.26, $0.28, and possibly at $0.31. The analysis indicated that a breakout over the resistance will likely continue into early September and the accumulation is increasing.
Notably, at press time, DOGE price traded near $0.22, testing critical trendline resistance.
According to Ali, the main consideration was how the price action stays above the breakout point. Without this, the rally could lose traction. The pattern continues to be constructive provided that the consolidation zone holds.
Symmetrical Triangle Completion
Furthermore, Trader Tardigrade observed that Dogecoin price completed wave E of a symmetrical triangle. His Elliott Wave analysis indicates that all the corrective periods have been completed.
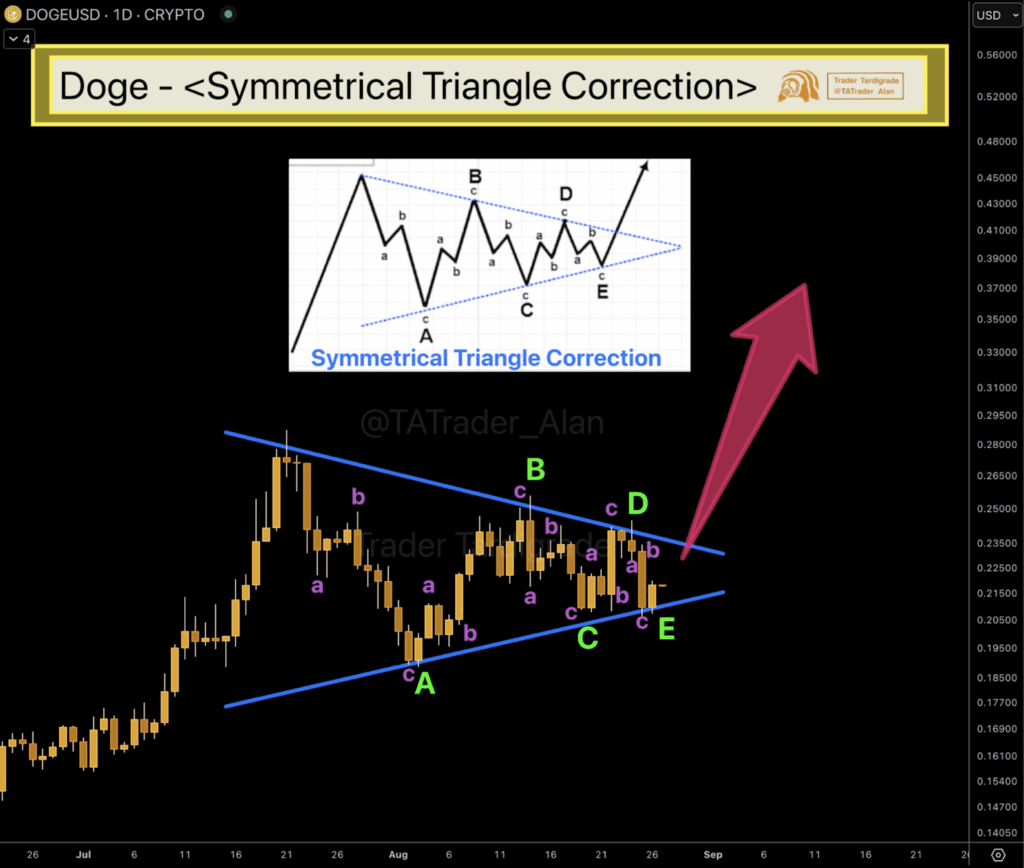
The analyst anticipated the upcoming movement to be an impulsive breakout. When a symmetrical triangle correction is formed and completed, it is frequently followed by a sharp resumption of the trend. This chart indicates the last bounce off support at $0.21, showing the end of consolidation.
This analysis suggested that the top memecoin was set to increase in the short term. This will require technical confirmation with stronger daily closes above the resistance. Meanwhile, the momentum indicators are seeing suppor,t implying that bulls are reclaiming leadership.
DOGE Resistance Levels Ahead
An essential liquidity gap in the charts was observed by market analyst CW. He observed that should Dogecoin price fail the sell wall around $0.24, the next area of resistance is not seen until around $0.28.
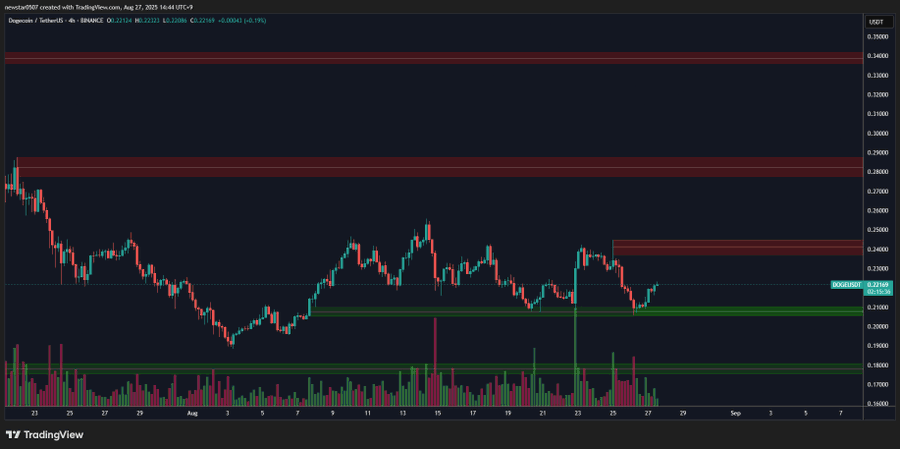
This setup indicates a clear upside path once Dogecoin price clears the overhead supply. The green support zones are still holding steady at $0.21 and $0.19, which extends the bullish sentiment. On the breakout attempt, traders can monitor the follow-through volume as an indicator.
CW analysis notes that the order book trend may influence the pace of price fluctuations. Low resistance at the range of $0.24- $0.28 can see volatility once it receives momentum.
Long-Term View Highlights Cup and Handle Pattern
Interestingly, Crypto Free Signals shared a broader perspective by tracking the weekly chart. The structure displayed an emerging cup and handle formation, usually seen as positive. The arrangement may have upside price targets extending beyond the 0.50 mark in the medium term.
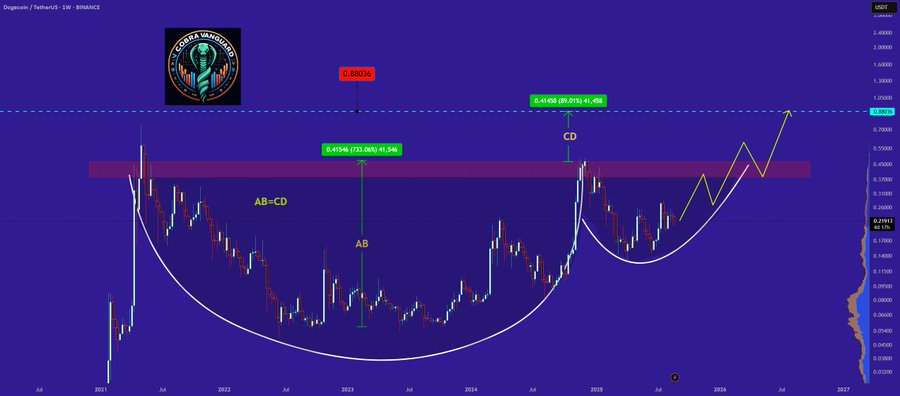
The pattern aligned with previous rallies where DOGE price surged after multi-year bases. The cup’s depth and handle formation present that it is likely to accumulate in the current ranges before proceeding to the next higher move.
Therefore, this viewpoint positions Dogecoin in a greater bullish trend that continues beyond short-term consolidation. The rally may stretch toward $0.70 or even further if the pattern is completed.


