Puffer
 Bitcoin
 ZKsync
 NEAR Protocol
 Walrus
 Pearl
Pearl Ondo
Ondo

Key Insights:
- BTC.D chart indicates liquidity will flow back to BTC by Sept/Oct: Benjamin Cowen
- The Alt Season chart is inching up to 53 from 51 a few days ago, and the Alt month chart is at 65.
- Ambitious price outlook points to $117K in the short term.
Bitcoin (BTC) has been struggling to catch a break since the Jackson Hole economic summit. The largest crypto by market cap is down by over $10,000 from its all-time high (ATH) of around $124,500 achieved two weeks ago.
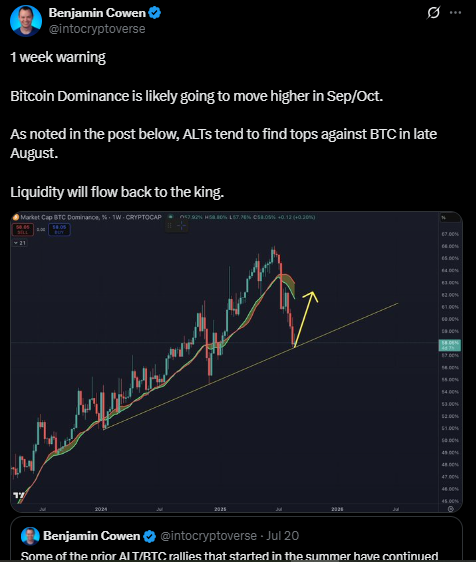
However, analysts are confident that this downturn is a case of seasonal blues. Benjamin Cowen noted that BTC dominance will rise back to the 60%+ level by September or October. Meanwhile, the altcoin season index is inching higher, whether you like it or not.
Here is an overview of how BTC generated drama in the past few hours.
Analyst: BTC Dominance Will be Back to Highs in Sept/Oct
BTC dominance was at 58.32% at closing on August 26th, 2025, TradingView data shows. It dropped 0.98% that day, and the previous day, it had gained 1.46%. August 19th was the last time BTC closed at 60% dominance.
The BTC dominance chart indicates the percentage share of BTC’s market cap in the crypto market. It is a signal for potential shifts in the market structure.
Recent alt season alarm calls were accompanied by warnings that BTC would experience a temporary downturn to make way for the alt season. In line with that view, Benjamin Cowen pointed out that BTC dominance would be out of the sub-60% zone by September or October.
However, Cowen’s view is based on a trend analysis, not the altcoin mania analysis per se. In a related post, he said that alt coins have been basked in this BTC downturn as well. The TOTAL3 (Crypto market cap excluding BTC and ETH) historical chart shows three times when a similar situation has happened. In each case, altcoins plummeted at the end of the frenzy.
Notably, while Ethereum (ETH) is an altcoin, its market cap share and recent performance merit its exclusion from an altcoin chart.
Early today, BlackRock acquired at least $452 Million worth of ETH, among many other institutions and whales that were simultaneously scooping it up.
Alt Season Index at 53, Alt Month Index at 65…
While it’s understandable to mop over BTC’s downturn and celebrate even the slightest uptick, one can’t deny the rise of alt coins (other than ETH).
The alt season index compares the historical performance of altcoins (including ETH, excluding stablecoins and wrapped coins) with bitcoin. The chart’s methodology is simple – if 75% of the top 50 alt coins outperformed BTC over a period of 90 days, we are in an alt season. On the other hand, if BTC outperforms 25% of the top 50 alt coins during the same period, it’s called a Bitcoin season.
As of writing this report, the Blockchaincenter.in data showed that the alt season index was at 53, and the alt month index was at 65. ETH and Solana (SOL) are likely going to lead an alt season. ETH was down 2.4% intraday, and around 3.2% up over the week, trading at $4,495.
Notably, ETH has attracted significant institutional and whale interest in the past few days. The highlight of the latest ETH drama is undoubtedly a dormant BTC whale selling over 20,000 BTC to go long on ETH. That whale’s BTC sale took BTC down by around $4000 in a few hours.
SOL was trading at $203, up 3.7% intraday and 8.2% over the week at the time of writing. X chatter showed ambitious (nearly ridiculous, to be precise) predictions for the token. Predictions ranged from $410 to even a whopping $600. Most of these wild predictions were on the long-term charts, including the 1-week and 2-week charts. Meanwhile, Cowen had noted that November had historically favored altcoins over BTC.
If the 4-phased alt season is something to go by, the crypto market is in the second phase – ETH absorbing BTC liquidity. The next phase would be marked by the rise of ‘large cap’ alt coins other than ETH, including SOL, ADA, XRP, among others.
BTC Price Outlook
Cowen’s assessment applies to the medium term, that is, for the next two to three months. Volatility is expected to characterize BTC’s performance near the $112,000 mark in the next few days.
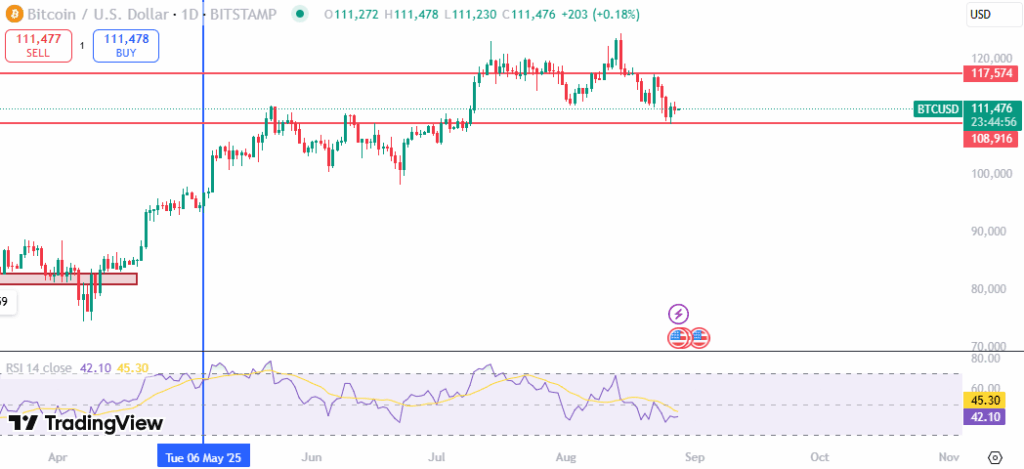
Per the 1-Day chart, $117,000 is a highly anticipated resistance level. If there’s a major bullish news or liquidity injection, $120,000 could also be in play very soon. However, as of now, conservative resistance estimates by analysts remain restricted to $117,000.
On the other hand, $108,000 is the local support level, conservatively speaking. The worst-case scenario would be a drop below $105,000. The worst-case scenario would be the aftermath of strong negative news.
A poor Personal Consumption Expenditure (PCE) data print (August 29th) is unlikely to significantly torture the BTC investor. That’s because the Fed chair seemed favorable to considering rate cuts in the next policy meeting.
Disclaimer
This article is for informational purposes only and provides no financial, investment, or other advice. The author or any people mentioned in this article are not responsible for any financial loss that may occur from investing in or trading. Please do your research before making any financial decisions.