Zylo Ecosystem
 Pearl
Pearl Walrus
 Derive
 Quantus
 Aerodrome Finance
 Sui
Sui

Ethereum price has rebounded after touching $3,800 and now faces a critical test of major resistance. Analysts believe a sustained breakout above key levels can pave the way towards $5,800 and above. The market’s next sessions will determine whether buyers can maintain strength and drive a long-term upward trend.
Ethereum Price Tests $4,060 Resistance After Bounce
Analyst Ted updated his analysis as Ethereum price retested the $3,800 liquidity level and rebounded above $3,900. He pointed out that it continues to trade below $4,060, an important resistance that should break up to support further upside.
Ted explained that a daily close above $4,060 would strengthen bullish momentum and could drive Ethereum price toward $4,265 next. A rally towards $4,752 will likely extend the recovery phase as buyers have validated the above $4,265 level.
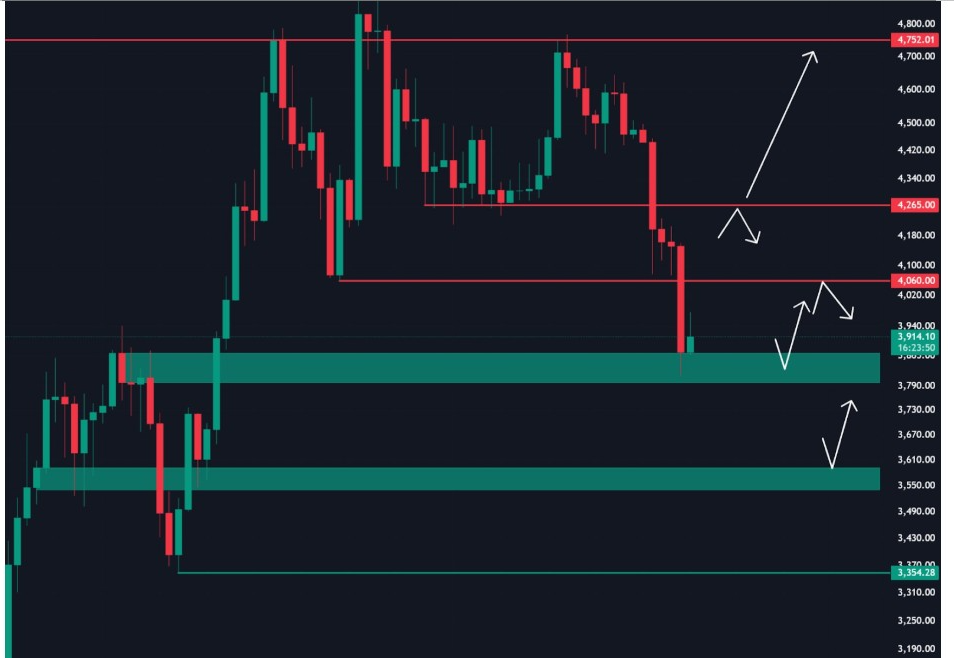
However, Ted stated that the risk of a break towards $3,600 increases if the $4,060 is not regained. His revised chart reflected the $3,600 level as another key support zone where demand will intensify after a strengthening of selling pressure.
He added that a strong bullish support of $3,800 combined with the rising volume indicates buyers are taking control again. This pattern would have Ethereum price moving higher towards the resistance, ultimately leading to the $5,800 price target.
Bullish Fractal Points to Massive Upside Potential
Furthermore, Trader Tardigrade shared a 3-day Ethereum chart displaying a large fractal pattern similar to the previous rallies. He noted that Ethereum is “gathering momentum for an upcoming massive surge”, making a comparison to earlier breakouts.
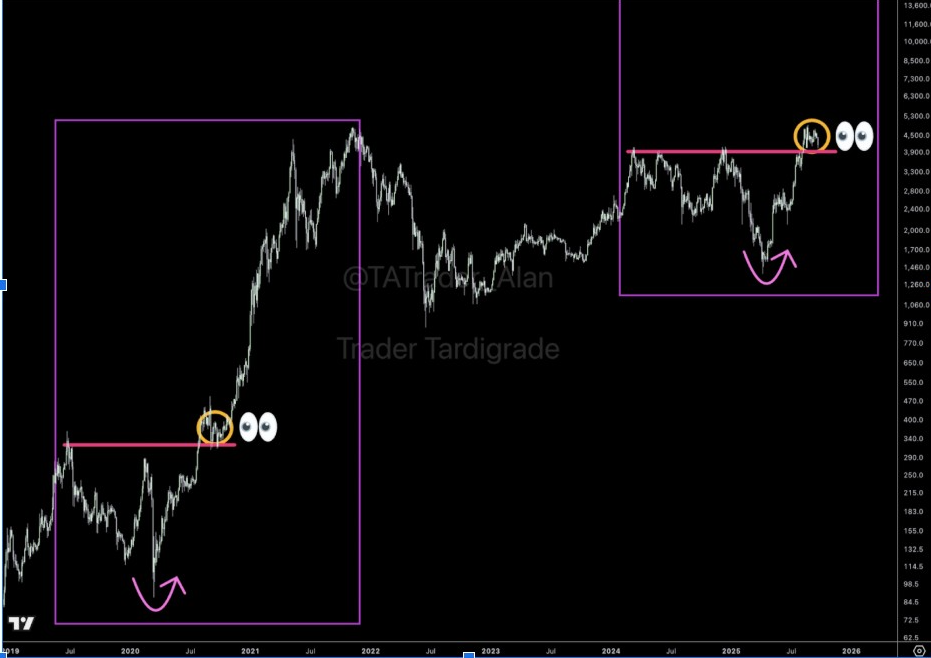
The fractal suggested that after a consolidation period, Ethereum price historically explodes higher. Moving past the key resistance zone would align with this repetitive setup.
This view reinforced that this consolidation could set up a strong multi-week rally. If history repeats, the price may move well beyond recent highs after clearing overhead resistance.
Key $4,841 Critical Point for Trend Reversal
Meanwhile, market analyst Ali focused on Ethereum’s MVRV Extreme Deviation Pricing Bands to map potential moves. He stated that Ethereum price must break $4,841 to reverse the downtrend and aim for $5,864.
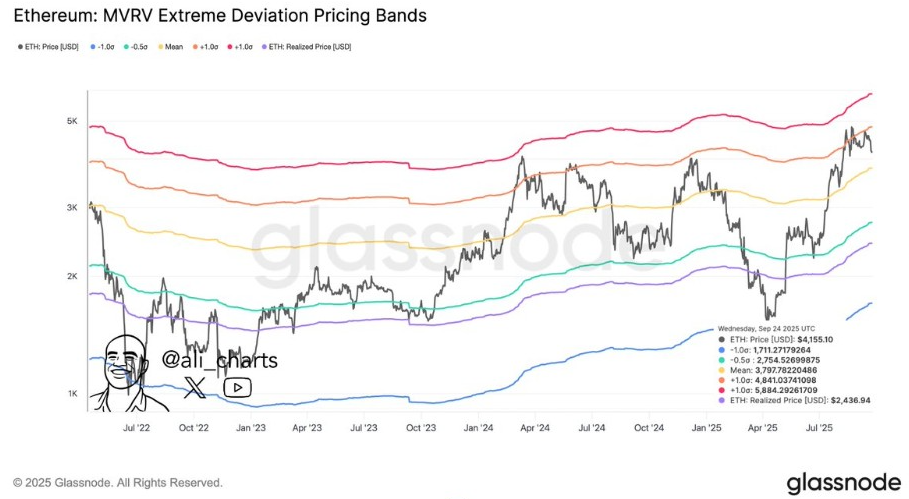
According to his model, failure to clear $4,841 and a deeper correction could fall to $2,750. At the time of his update, ETH price traded near $3,855, making the $4,841 breakout a crucial hurdle.
Ali’s analysis provided a medium-term roadmap, stressing that breaking this key price zone is essential for a sustainable bullish trend. Until then, the market may be susceptible to profit-taking and lower.
He added that holding above $4,060 while eyeing $4,841 would support bullish momentum. Breaking that upper resistance could trigger a powerful rally toward $5,800 or higher.
Sharp Dip Zone Signals Possible Buying Opportunity
Analyst Merlijn The Trader updated his outlook as Ethereum price extended its decline inside a clear dip zone. He noted the coin has dipped to about 16% below recent highs, which matches his expected “buy the dip zone” between the 50-day and 100-day moving averages.

Merlijn pointed out that these technical zones previously signaled accumulation before major rallies. He explained that weak holders see risk, while stronger hands treat the pullback as an entry opportunity.
This updated outlook supported his belief that the retracement is a natural step in Ethereum’s broader bullish cycle. If this pattern continues, recovery from this zone could help price build the base of a strong bounce.
He further indicated that consistent coiling around the 100-day moving average frequently results in strong upside moves. Holding above this zone could see ETH price regain resistance and breach towards the $5,800 price level.