Pearl
Pearl Zylo Ecosystem
 Bitway
 Walrus
 Starknet
 Quantus
 Pudgy Penguins

Shiba Inu price is showing resilience despite market volatility. It remains steady near key support levels. Meanwhile, its holder count continues to grow. The steady rise in holders signals strong community engagement.
It also reflects long-term investor confidence. This trend aligns with the current technical outlook. This suggests a possible rebound that is developing at the key support areas.
Shiba Inu Price Holds Firm at Key Support Levels
The 4-hour Shiba Inu price charts show the token is finding stability. It’s holding within a key horizontal support range of $0.00001150 to $0.00001180. This price area has served as a starting point for several bullish reversals over the last several weeks.
There have been slight declines to the lower limit. However, buyers have returned to the market and regained the price, returning to the consolidation area.
The current price performance indicates that the base-building stage is robust. As of press time, SHIB is trading at approximately $0.00001173, having fallen below the support band.
The market structure of the chart suggests that the market is attempting to absorb selling pressure before it can rise.
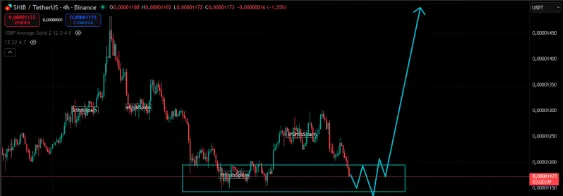
A closer examination of the candlestick behavior supports another examination of the accumulation in this zone. The fact that the support range is repeatedly tested, with no serious breakdowns, is evidence of increasing confidence among buyers.
Historical trends suggest that similar formation patterns preceded positive impulses in the SHIB market. This was especially the case when they were supported by an increase in volumes and optimism based on on-chain activities.
Falling Wedge Structure Points to Compression Phase on Shiba Inu Price Crypto
Daily Shiba Inu price charts indicate the formation of a falling wedge pattern, a generally bullish technical indicator. The wedge spans from the September high of about $0.00001500 to the current volatile level near $0.00001200.
This range is slowly narrowing as the pattern becomes more compressed. This trend typically indicates that the downward trend is losing its momentum and buyers are slowly regaining their footing. SHIB is approaching a key wedge resistance near $0.00001300.
A confirmed breakout above this level could signal further upside. The next resistance zones are around $0.00001450 and $0.00001500. These levels may define the token’s short-term price targets.
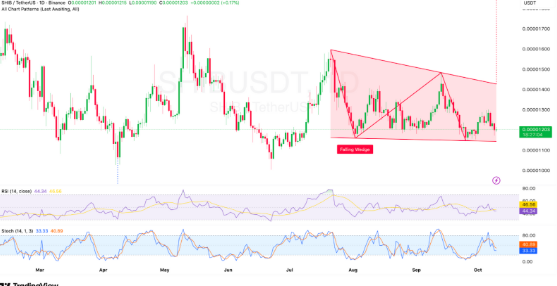
The Relative Strength Index (RSI) of the day is 44.34, and the number is almost in the middle. The token is neither overbought nor oversold at the moment. It’s showing upward growth, signaling rising buying pressure.
On the same note, its Stochastic RSI stood at 33.33. Also, the signal line of the Stochastic was at 40.89, indicating a bullish divergence.
On-Chain Growth Underscores Investor Confidence
Besides the charts, on-chain metrics indicate stable network development, despite the rather dull prices. Recent blockchain information shows that the total number of SHIB holders has reached 1,544,810.
This represents further growth and expansion, even during times of consolidation. It also suggests that retail and long-term investors remain committed to the ecosystem.
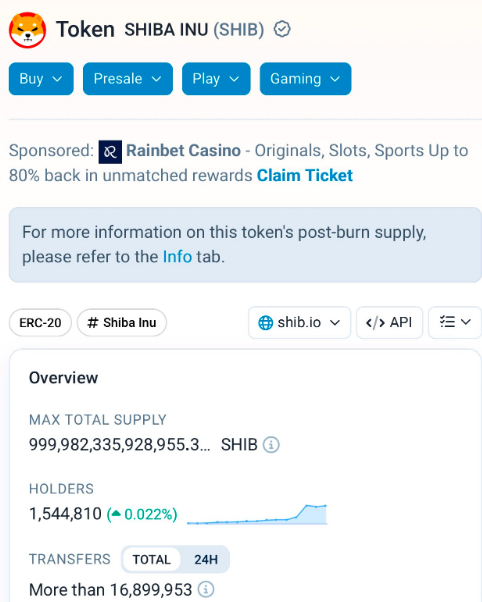
This steady expansion in the number of holders is typically an indicator of good community participation and less speculative trading.
During previous consolidation phases, wallet counts rose steadily. This was followed by moderate price gains as accumulation built ahead of broader market moves.
The steady number of holders points to a growing investor base. Most SHIB tokens remain in non-exchange wallets, showing long-term commitment. This is a measure commonly associated with both low selling pressure and a long-term perspective.