
 Bitcoin
 Pearl
Pearl Quantus
 NEAR Protocol
 Ondo
Ondo Walrus
 Pudgy Penguins

Solana price continues to recover as overall altcoin market optimism increases. Analysts say Solana is testing key resistance zones, as the total altcoin market cap enters a crucial decision phase. When the next significant breakout occurs, this combination of technical setups suggests a fresh influx of capital into Solana.
Solana Price Crash Consolidates Near Key Resistance
Solana price is holding steady near the $195 level, reflecting a strong market structure after a period of correction. BitGuru noted that the market is attempting to recover from recent pullbacks, but buyers are now holding the middle ground at the mid-$190 range.
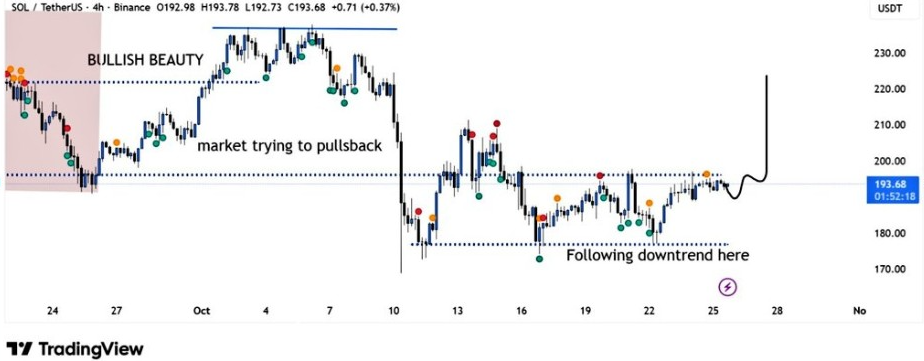
Market indicators are improving, indicating that Solana is poised for a move towards the $210-$220 range. A move above $195 will confirm the beginning of the next short-term rally. BitGuru stressed that the structure is reminiscent of prior accumulation since the last major move up.
If Solana price continues to follow this path, buyers may take control and drive the asset towards upper resistance levels. The 4-hour chart is tightening range; horizontal consolidation is usually followed by expansion of volatility.
Whale Rotation Adds Market Context
According to on-chain tracker Lookonchain, a major whale transaction occurred, involving a swap from Solana to Ethereum. The whale sold 99,979 SOL at an average price of $185, totaling $18.5 million, and bought 4,532 ETH at $4,084.
While some view this as profit-taking, others understand it as rebalancing within a portfolio diversification strategy. Despite the rotation, Solana’s trading volume and liquidity remain solid, indicating that institutional players continue to be active in accumulation.
The shifting of allocations across Solana and Ethereum showcases how large investors dynamically adjust their positions in times of market uncertainty. Such activity typically leads to volatility in both assets as liquidity is transferred across networks.
Analysts Identify Key Solana Price Levels
Analyst Ali Charts mentioned three essential levels for Solana, which are: a resistance level at $260, a support level at $115, and a support level at $50. He highlighted that the thresholds have been historically used to outline Solana’s long-term direction.
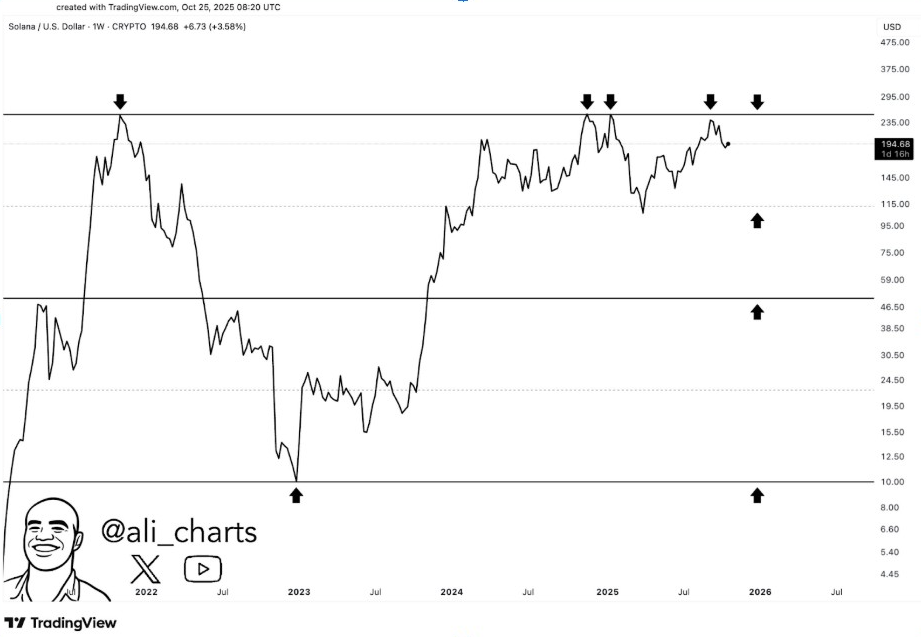
The price chart of the token indicates multiple rejections close to $260, validating it as a significant breakout level. A continuing close above this level may initiate a bullish continuation, in line with the overall altcoin recovery story.
On the other hand, support near $180 is crucial for bullish momentum. The ability of Solana to hold around these levels indicates that active buyers are defending mid-range zones, and if so, it could be a sign that the next move toward further expansion is on the horizon.
Altcoin Market Nears the Decision Zone
Analyst Merlijn the Trader said that the altcoin market in general is now entering a “decision zone,” a classification akin to how the situation was before the previous altseasons. His chart reveals that the present structure is similar to the ones seen before the 2017 and 2021 rallies.
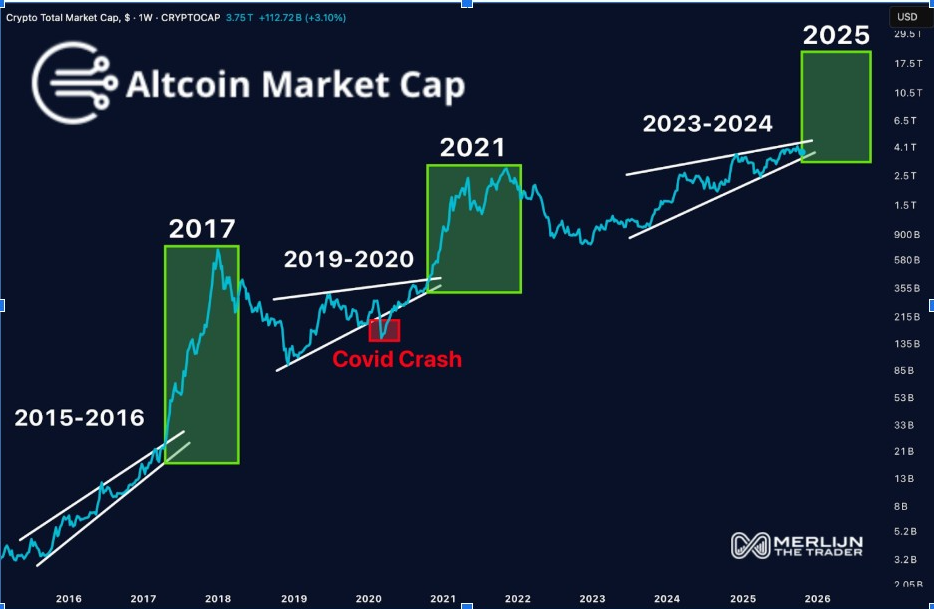
He observed that “every altseason began when doubt had reached a peak,” which is indicative of the fact that hesitation in the market tends to be followed by significant upward movement. Historical results have shown that after long-term consolidation, altcoin market capitalization tends to increase significantly when market sentiment changes.
If this trend repeats, SOL price may be one of the first major assets to take the lead. The correlation between Solana’s consolidation near its resistance level and the positioning of the altcoin market reinforces the bullish case for a broad-based recovery into 2025.


