
 astronaut
 Pearl
Pearl NEAR Protocol
 Walrus
 Zylo Ecosystem
 Bitcoin
 Hyperliquid

XRP price is approaching a critical stage that could make or break its next major uptrend. Multiple analysts expect a bullish continuation as long as support holds between $1.85 and $2.
Technical patterns are now displaying a combination of triangle and flag patterns and are poised for expansion towards $10 and above.
XRP Price Builds Toward Macro Breakout Structure
Analyst ChartNerd revealed that the XRP price was still in a long-term ascending structure, converging with major resistance. His multi-year Gaussian and EMA confluence indicates breakout setups at $8, $13, and $27, following momentum acceleration.
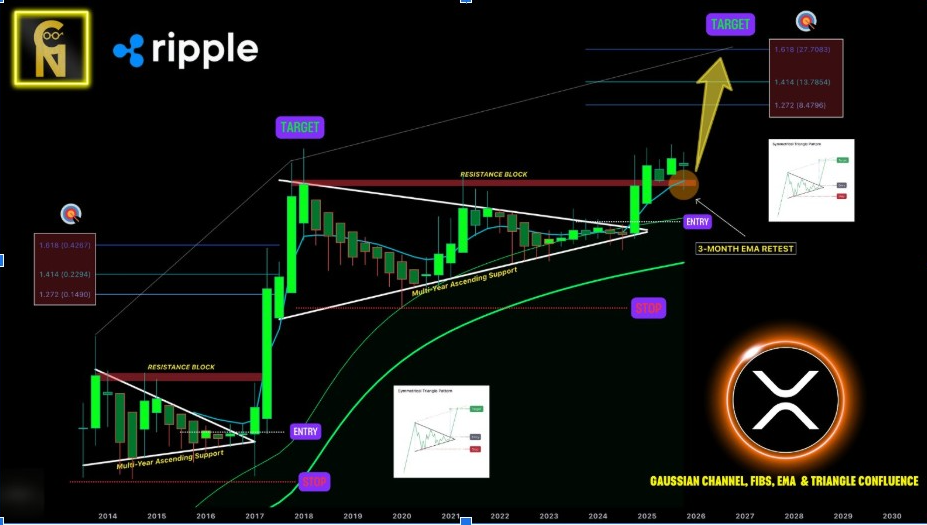
The chart showed a long-sided symmetrical triangle dating back to 2017, with XRP retesting its 3-month EMA. ChartNerd stated that the macro fractal is “a coming upside phase,” saying that time is on its side.
He marked $1.80 as the structural base from which previous bull runs began their rebounds. A sustained close above $3 could lead to exponential growth, similar to what was seen in 2017.
As long as the monthly candles remain above trend support, buyers will likely remain in control. The conjunction of EMA, the Gaussian channel, and the Fibonacci targets validates that XRP is “ever so close to takeoff.”
Bullish Flag Formation Aligns With Long-Term Setup
Analyst Ali explained XRP’s pattern as a monthly bull flag, which could be considered a continuation signal. He commented that a short dip in the $1.90 area could trigger a breakout advance to $10 once consolidation is over.
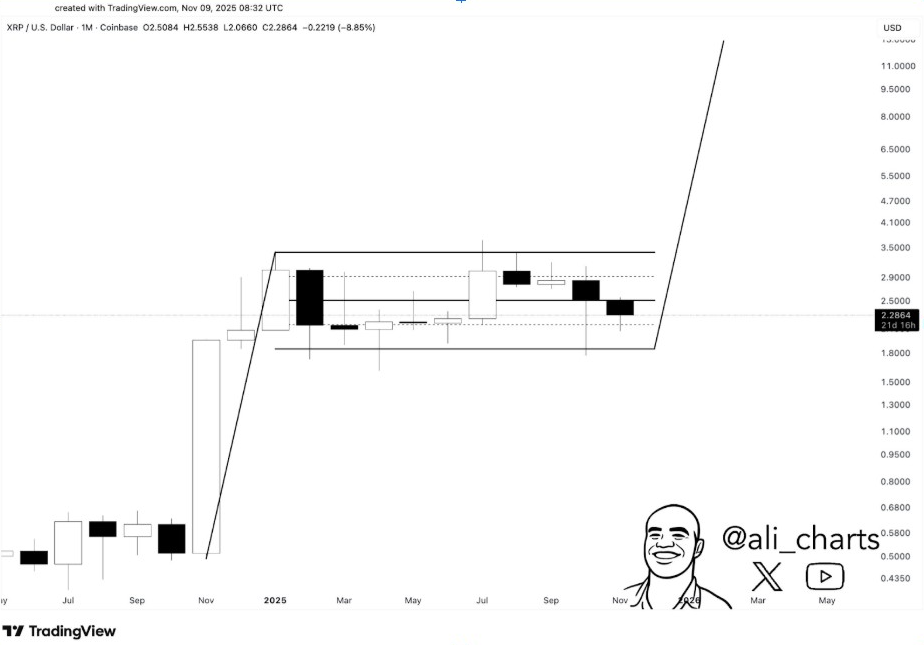
The chart revealed a steep vertical leg, followed by parallel areas of resistance and support that form a flag range. Such patterns usually precede strong continuation waves when momentum returns above the upper trendline.
Ali stressed that this “dream scenario” is favorable to buyers aggregating in the $2 region. A confirmed breakout may repeat XRP’s historical parabolic cycles, particularly during macro uptrends.
Momentum indicators show oversold readings that align with previous rebound zones. If the flag holds, XRP could replicate its rise by a factor of 10, similar to its previous increases in 2017 and 2021.
Institutional Base Strengthens Between $1.85 and $2 Support
Analyst Crypto Patel pointed out a $1.85-$2 range as the best accumulation zone for XRP, supported by significant liquidity inflows. He referred to this region as the “re-entry base” that institutions have defended several times since Q1 2025.
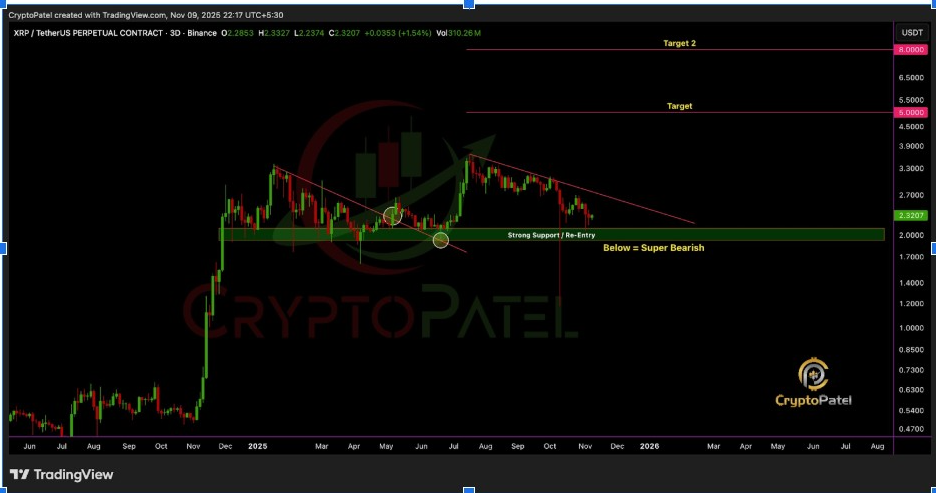
His analysis revealed a wide descending channel impinging on the green support block visible on the 3-day chart. Patel predicted structural expansion to $5 and $8, with the price holding this floor and volume increasing.
Momentum is still very bullish above this range, and a close below $1.85 would nullify this formation. He added that the market is “preparing itself for structural lift-off when supply zones break.”
Technical oscillators are still stabilizing near neutral levels, suggesting the potential for a continued trend reversal. Buyers appear poised to defend this critical accumulation range, similar to the configurations seen in 2020 and 2021.
Trend Retest Signals Early Move Toward Resistance
Additionally, World of Charts noted that XRP just completed a successful retest after breaking out of a local falling wedge. He wrote that price may now approach the descending trendline near $2.70 to $2.90 before deciding which way it will go next.
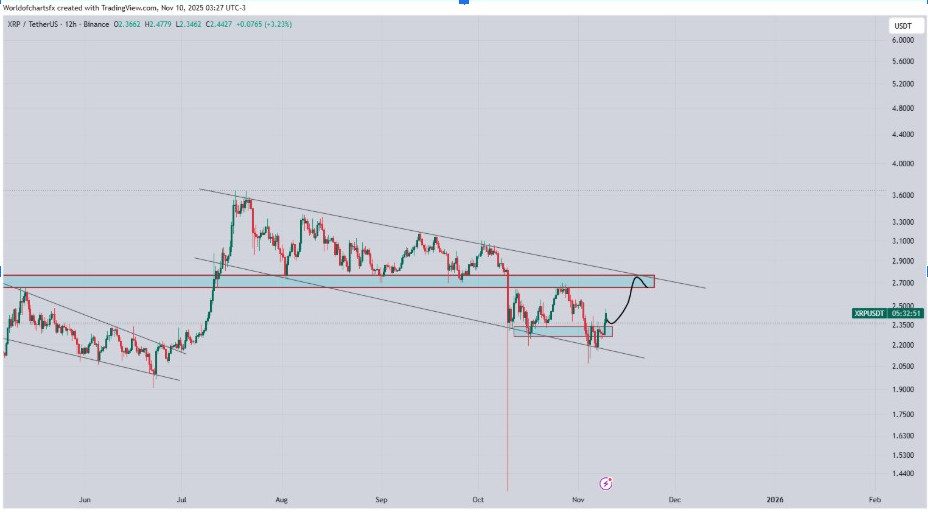
The 12-hour chart revealed a pattern of higher lows developing from the September capitulation zone. New structural support was confirmed by the retest, turning the breakout into a stable base for further upward continuation.
He forecast a possible surge towards the top boundary if the momentum continues. A clear breakout above $3 would leave targets at $5 and above the zones discussed by other analysts.



