Minter
 Bittensor
 Hyperliquid
 NEAR Protocol
 Monero
 Pearl
Pearl Quantus

The altcoins season index is beginning to rise as market rotation signals return in multiple analytical models. Sentiment around altcoins is improving following multiple trendline reactions throughout long-term charts. Analysts have observed growing similarities between historical cycle structures and current market behavior.
Altcoins Season Index Indicates Early Accumulation Signs
The altcoin season index has begun to head higher after hitting a multi-month low. This shift suggests a possible change from Bitcoin to altcoins, similar to previous pre-season phases. Recent readings are around 29, fractionally above last week’s value. The index is still in Bitcoin season, but upward pressure is building.
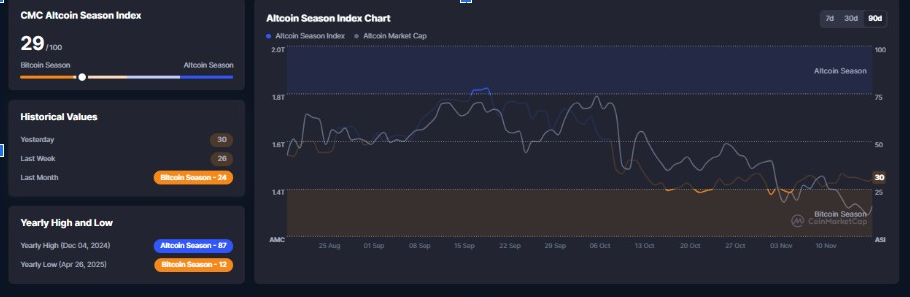
Data from CoinMarketCap showed a minor recovery in the altcoin market cap. The index chart shows a slow, gradual rise from the early November lows. Momentum remains weak, but the structure has shown some early accumulation. Traders are eyeing a break above 40, which often leads to broader altcoin strength.
Historic Fractals Support Expanding Cycle Outlook
CryptoElites pointed out a multi-cycle pattern that has been repeated in two previous market expansions. Their chart depicts the major 50x altcoin waves in 2017 and 2021. Both expansions followed similar structures, including a distinct bottom before acceleration. The same trendline has now been touched again.
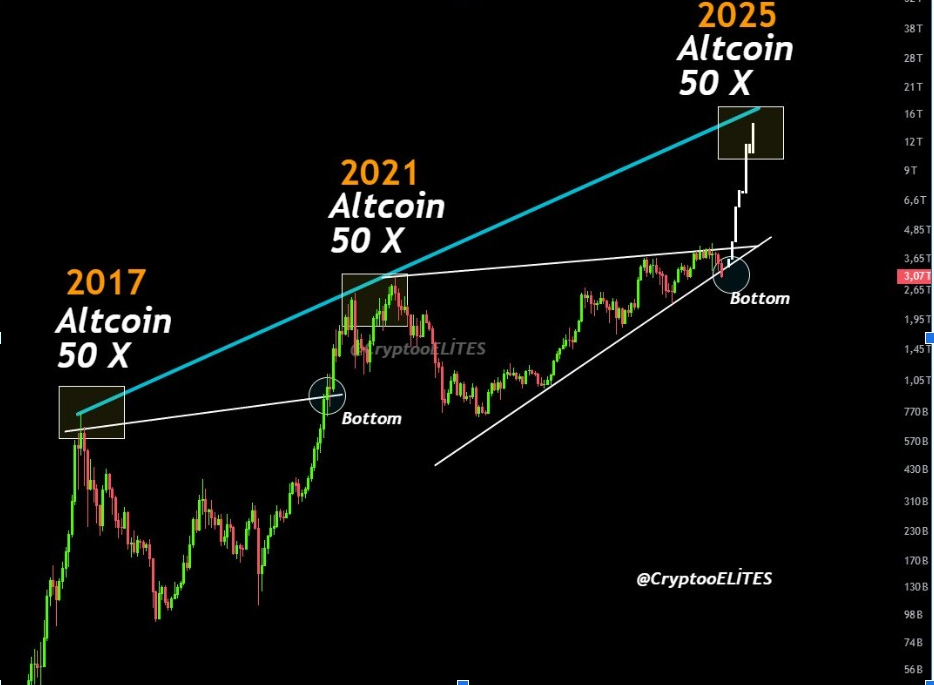
The 2025 region aligns with the projected third wave in the long-term fractal. Each of the previous expansions was initiated following a sharp retest of the trendline. CryptoElites notes that the trend structure remains intact and the pattern still rhymes across cycles. This model suggests potential upside if past behavior is repeated.
Total2 Chart Hits Long-Term Support Zone
Another point of view is that of analyst Moustache, who tracks Total2, the market cap excluding Bitcoin. His chart’s 8.5-year trendline has now touched again. The same trendline led to the altcoin seasons of 2017 and 2020. The price has responded to this level with a slight recovery bounce.
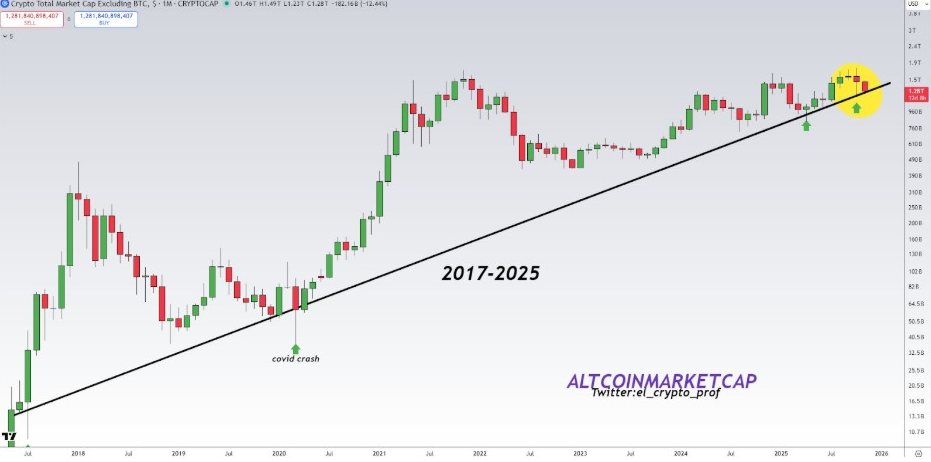
Moustache noted that Total2 is still above the long-term diagonal. This implies that there is still structural support. A breakdown would be a sign of weakness, but we see resilience at present levels. The chart shows a strong historical reaction each time this line has been tested.
CoinMarketCap data supports this technical structure, with a slight recovery in altcoin market caps. Total2 has settled back towards the long-term average. This stabilization is often preceded by general recovery if market rotation begins. Investors will be looking for more inflows as confirmation accumulates.
USDT Dominance Rejection Supports Rotation
AltcoinPioneer provided another signal aligned with early rotation conditions. Their chart showed USDT dominance rejecting a multi-month ascending trendline near 5.85%. The rejection candle was a bearish engulfing pattern signaling selling pressure. This pattern represents the shift of money away from stablecoins and into risk assets.
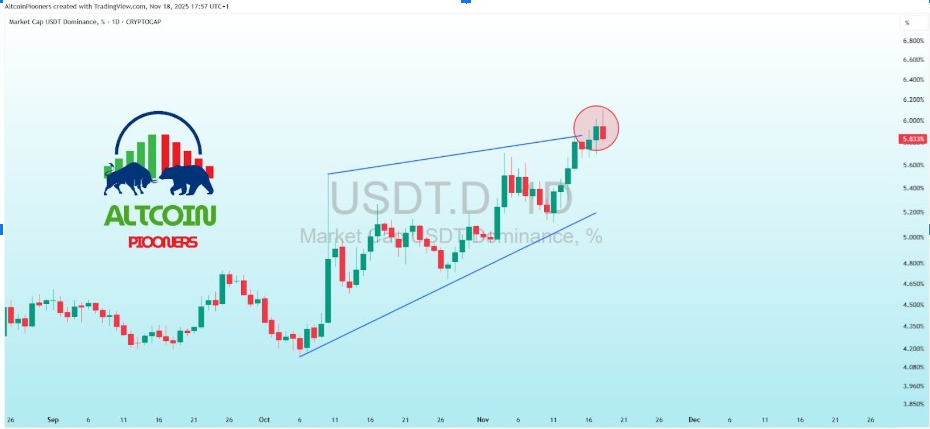
The next target for USDT dominance is around 5.2%, which aligns with previous cycle lows. A drop to that zone would be bullish for an altcoin season. AltcoinPioneers noted that a break above 6% would signal a risk-off flow, but the current structure favors rotation. Bitcoin also lies at a macro support level, which increases the likelihood of a coordinated market move.
The larger market continues to follow these signals closely. If the dominance of USDT declines further, liquidity may shift into mid- and small-cap assets. This transition is historically the beginning of better altcoin performance.