
 Zylo Ecosystem
 Walrus
 Bitcoin
 Sui
Sui Quantus
 Quant
Quant Starknet

Solana price is entering one of its most stressed phases of the current cyclel, as on-chain data shows the majority of the network’s circulating supply is now underwater. 79.6% of all SOL in circulation is now at a loss, a condition that typically occurs during significant market resets.
Glassnode data shows that the percentage of the supply in profit deteriorated above 70% in October 2024 to almost 20% at the end of November 2025. The decrease is among the most significant since the beginning of 2023.
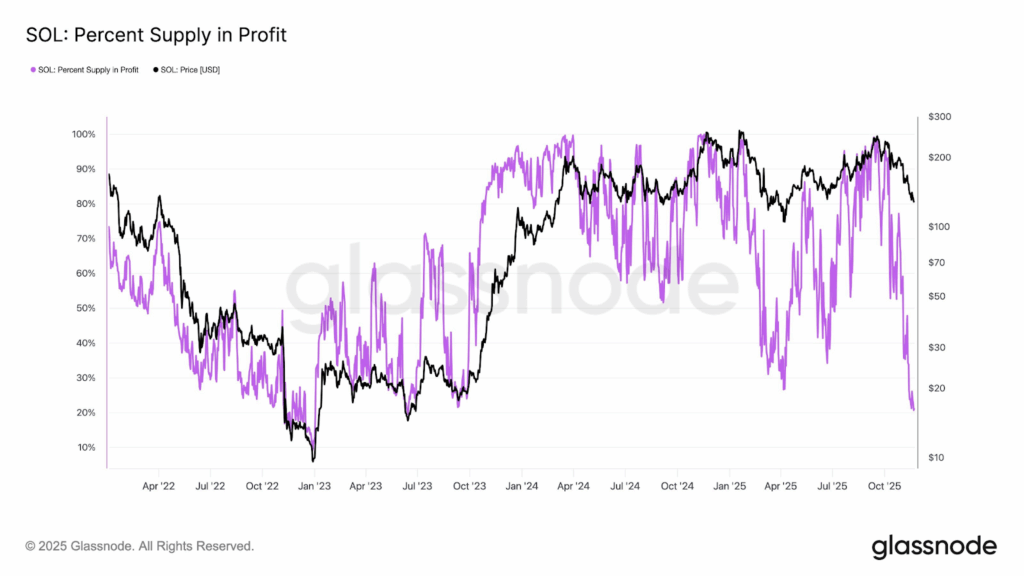
There are historical trends that are particularly applicable to this data. Profitability ratios under 25% have been observed twice. The ratio was first observed in June 2022, when the market was forced to contend with the collapse of the LUNA market.
The ratio was again seen in December 2022, when the market had to process the FTX meltdown. Both occurrences subsequently coincided with structural basing periods that preceded several months’ rallies by Solana.
The chart reveals the same profitability compression in the month of September 2023. The period preceded the strong advance from $19 to $68 in the final quarter of that year. These cyclical profitability troughs are indicators that the market is returning to long-standing capitulation pressure levels.
Analyst Notes “Perfect Entry” as Solana Tests Long-Term Structural Support
More chart data shows that Solana has reverted to what they consider to be an attractive long-term entry zone. The chart presents a sweep over the structure that reflects those of the previous arcs of Solana’s basing, specifically the arc made between the end of 2021 and March 2024.
The model describes two cup-shaped structures. The first one is breaking out in early 2024, and the second one is evolving currently by the 2025 drawdown.
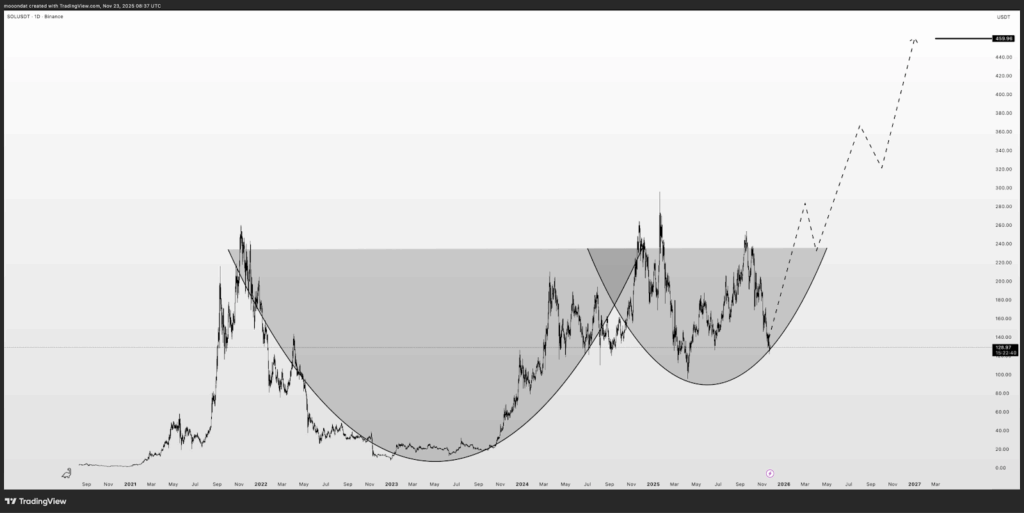
The area between $120 and $150 harboured a sustained buildup during the second half of 2023. Solana price made a base during that time between July and October. We also saw swings around the $20 mark before picking up pace and breaking out in December of 2023.
The graph indicates that the present revisit of this structural demand zone has a similar nature. This is evident in that the Solana price action trades with the upwardly sloping cyclical arc of the long-term cycle.
The current profitability collapse coincides with SOL trading between $128 and $132. This region previously served as a significant pivot point in March 2024, as Solana transitioned from a prolonged accumulation range to rapid upside momentum.
The return to this area, coupled with widespread supply losses, indicates that holders are now deeply underwater.
Momentum Indicators Point Toward Stabilization at Weekly Support
More charts confirm that Solana has entered a significant inflection point. The daily chart shows a downward formation of a wedge pattern that started to form at the end of September 2025 due to a breakdown of $188.
The wedge continues to narrow as the Solana price compresses into the mid-$120 region.
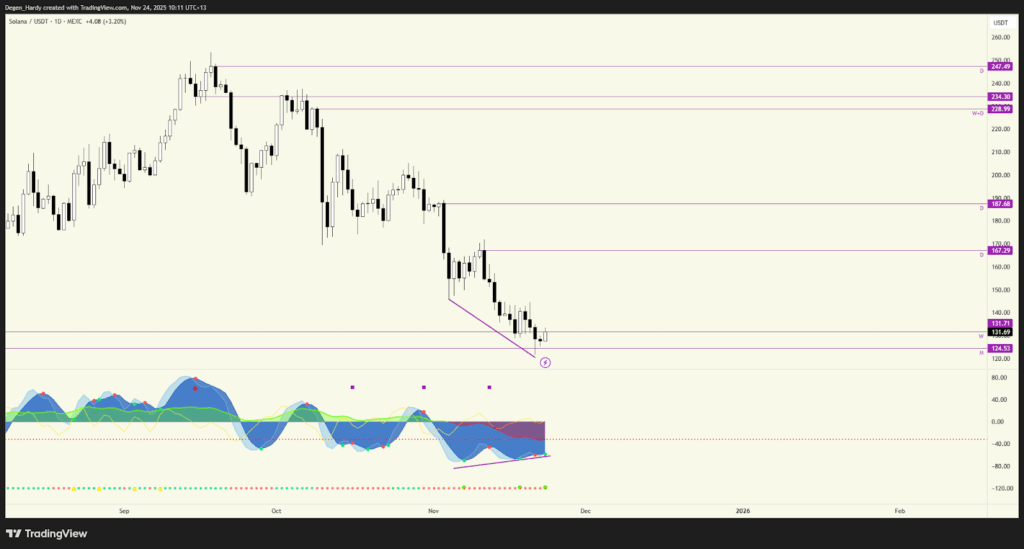
The momentum indicators at the bottom half of the chart display a strong divergent signal, indicating a bullish trend. The oscillators are drawing higher lows, and the price is drawing lower lows.
This divergence was also observed in October 2023 and March 2024, respectively, after which a multi-week recovery occurred. The signal shows that it is losing selling momentum despite the Solana price returning to the lower technical levels.
According to the setup, the subsequent action by SOL would be to bounce hard, due to divergence, oversold readings, and multi-timeframe confluence on support. Price is now trying the weekly support level of $131.71, which has been active since the beginning of 2023.


