
 Pearl
Pearl Bitway
 Zcash
Zcash Walrus
 Aerodrome Finance
 Starknet
 NEAR Protocol

Solana price has climbed back above $140, reaching as high as $146 after a sharp recovery from recent lows. The move comes as SOL rebounded from a 24-hour low of $139 and a seven-day low of $123.
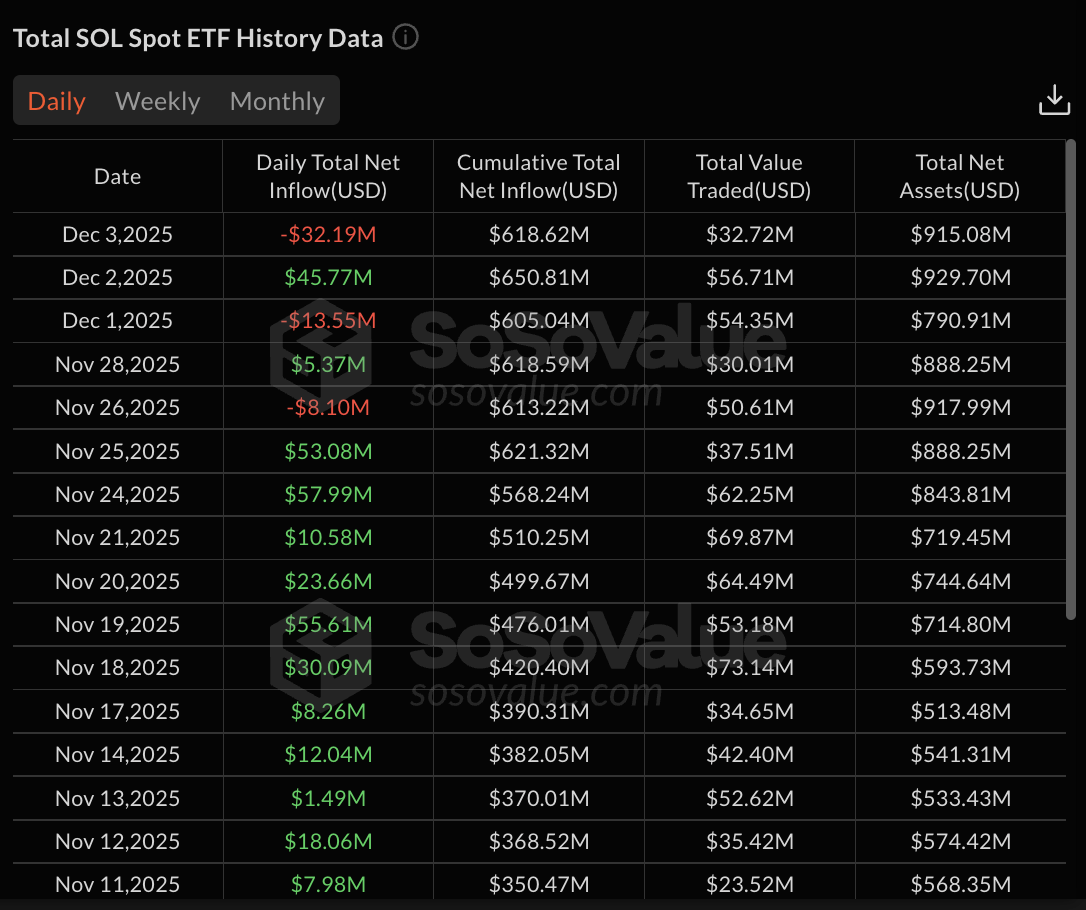
SOL ETFs posted $32.19 million in net outflows on December 3, reversing the previous day’s $45.77 million inflow.
SOL ETFs Swing to $32.19 Million Outflows
Data from SoSoValue shows that SOL ETFs recorded $32.19 million in net outflows on December 3. The figure comes after the products posted $45.77 million in inflows on December 2.
21Shares’ TSOL drove the bulk of the outflows and recorded $41.79 million in redemptions. The product saw 295.71K SOL tokens exit, bringing its cumulative net inflow to negative $101.51 million. TSOL remains the only Solana ETF with negative cumulative flows.
Bitwise’s BSOL provided the largest offset to the outflows with $5.57 million in net inflows. The product attracted 39.41K SOL tokens, pushing its cumulative net inflow to $579.99 million. BSOL maintains its position as the largest SOL ETF by total assets.
Fidelity’s FSOL recorded $1.66 million in inflows with 11.71K SOL tokens added. Grayscale’s GSOL posted $1.55 million in inflows with 10.98K SOL tokens.
Canary’s SOLC saw modest inflows of $817.92K, while VanEck’s VSOL and Franklin’s SOEZ reported zero activity.
Cumulative SOL ETF Holdings Remain Substantial
The December 3 outflows bring the cumulative total net inflow for SOL ETFs to $618.62 million. Total net assets across all Solana ETF products stand at $915.08 million. Trading volume on December 3 reached $32.72 million, reflecting strong interest in the Solana price.
On December 2, total net assets reached $929.70 million. Trading volume hit $56.71 million, showing strong market activity. Historical flow data shows SOL ETFs have experienced periods of both strong inflows and sharp outflows since their launch.
November recorded mostly positive flows. The biggest inflows came on November 3 ($70.05M), November 24 ($57.99M), and November 19 ($55.61M).
Solana Price Tests Key Support Level
Solana price action over the past seven days saw the asset test the $123 level before staging a recovery above $140. The 24-hour trading range shows a jump from $139 to $146.
Analyst Rekt Capital noted that Solana is trading within a defined macro range. The boundaries are set between $123.28 on the lower end and about $296.27 on the upper end. The asset has been clustering in this region since early 2024.
The first major rebound from the $123.28 support level rallied approximately 140%. The next rebound from the same support was smaller, rallying around 100%. Solana is now rebounding from this level again, making it the third test of this key support zone.
Rekt Capital highlighted that the rebound looks encouraging for now. However, if it proves weaker than past rallies, doubts could emerge about the durability of this support.
Institutional Accumulation Thesis Persists
Trader MartyParty pointed to on-chain data showing massive flows of USDC to Wintermute from Coinbase, Circle, and Bullish. The analyst stated these flows show institutions are buying all the SOL for their portfolios.
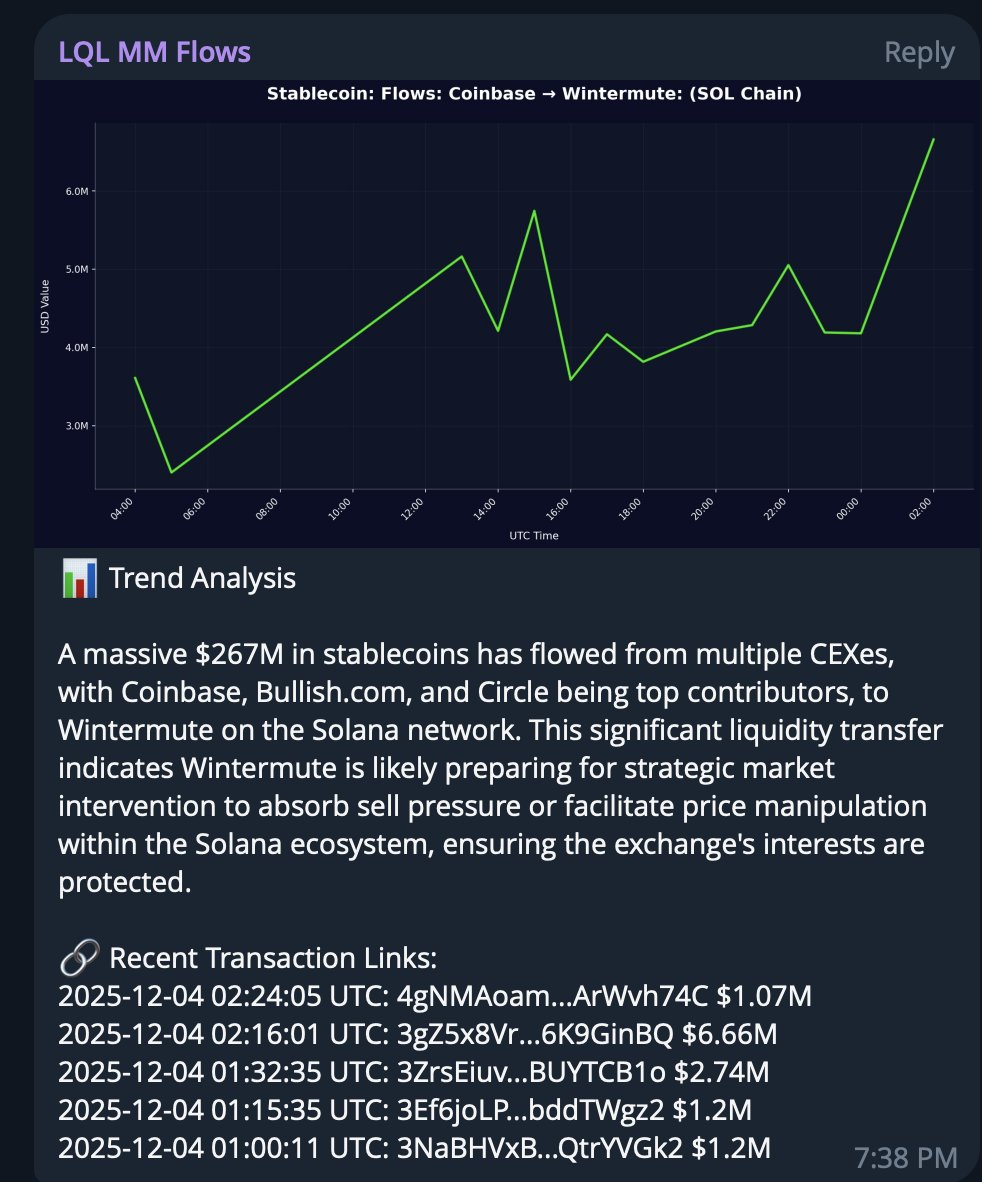
“The meme’rs, airdrop farmers and tourists are out. Thanks for testing the network. The new owners of $SOL are institutional investors,” MartyParty wrote. The trader suggested accumulating under $200 for potential 5x returns.
The thesis builds on the observation that retail-oriented activity has dropped while institutional flows have picked up. USDC movements to market makers like Wintermute often precede large purchases executed on behalf of institutional clients.
Solana Price Faces Technical Resistance
Rekt Capital’s analysis shows that the Solana price must break key resistance levels. The price needs to clear either the black downtrend or the multi-week downtrend.
This move must happen on the weekly timeframe to confirm strength. Failing to break either of these trendlines would produce a smaller rally than previous rebounds.
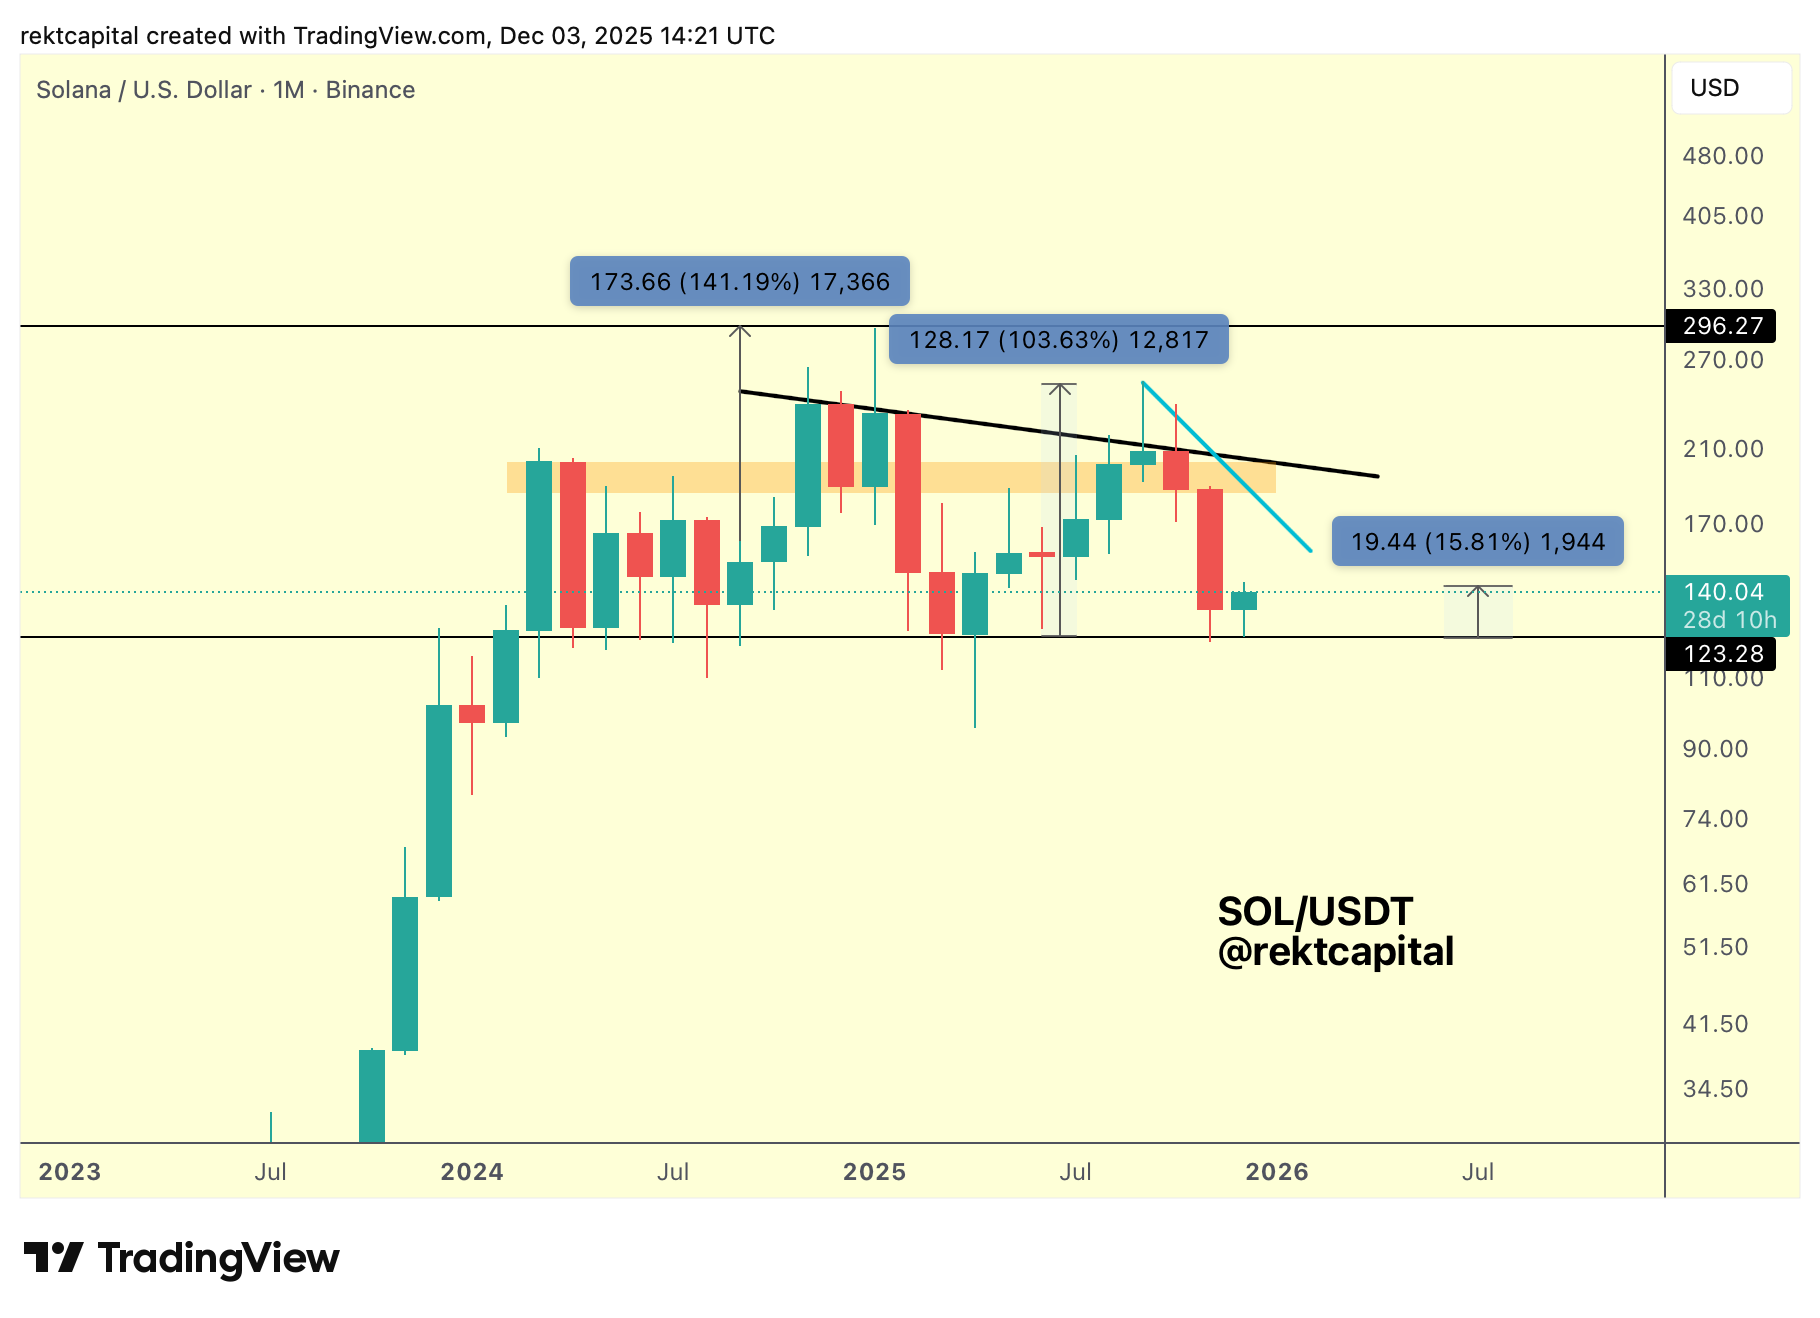
The prior rebound that rallied around 100% fell short and was rejected by these downtrends. If the current move follows the same pattern, it would confirm weakening momentum on each successive test of support.
Solana faces weakening rebounds if it fails to break the downtrends. The price must also clear the orange resistance region. Without these moves, the $123.28 support will lose strength.



