
 Walrus
 Quantus
 Pudgy Penguins
 Bitway
 Quant
Quant Sui
Sui Bitcoin

Altseason expectations are rising as market structure begins to stabilize across major altcoin benchmarks. Charts tracking altcoins against Bitcoin and total market capitalization show early signs of basing. Price action now centers on whether reclaimed support levels can hold. These developments come as traders monitor rotation signals rather than broad risk appetite alone.
Market analysts are focusing on relative strength, support defence, and short-term moving average behaviour. Together, these factors shape the current Altseason setup without confirming a full trend shift.
Altcoins Hold Breakout Against BTC, Altcoin Season Coming?
One widely followed chart tracks the altcoins-to-Bitcoin ratio (ALTS/BTC). The ratio spent months moving lower within a descending structure, reflecting Bitcoin dominance during earlier phases. That structure has now been breached, with price pushing above the former downtrend line before pulling back.
The current retest zone serves as a technical checkpoint. Holding above the reclaimed trendline maintains the breakout integrity and signals an improving relative demand for altcoins. Failure to hold would return control to Bitcoin and weaken the rotation narrative. For now, the ratio remains above prior resistance, keeping the setup active.
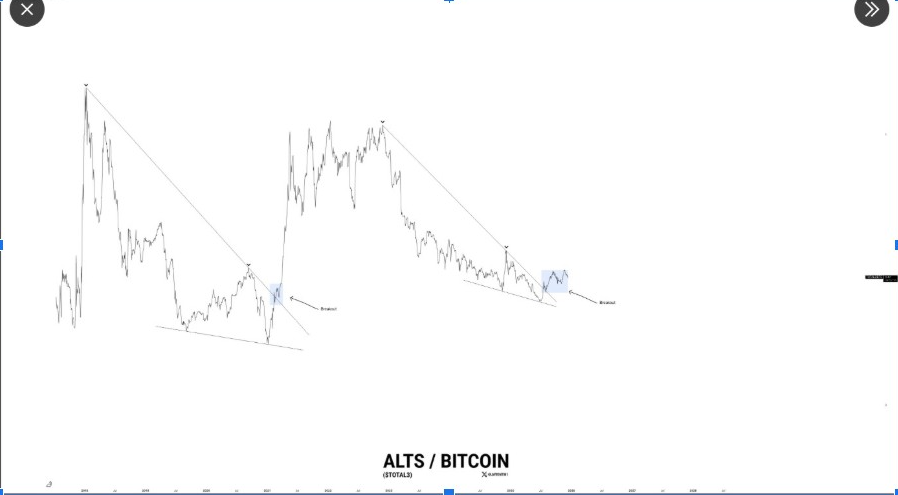
Historical price trends show that sustained ALTS/BTC breakouts often coincide with participation beyond Bitcoin. The ratio does not need to surge immediately to support that view. Stability above the retest zone is enough to suggest that capital rotation remains possible rather than stalled.
Total Market Cap Excluding BTC and ETH Stabilizes
A second chart tracks total crypto market capitalization excluding Bitcoin and Ethereum. On the daily timeframe, recent data shows an open near $869 billion, a high around $876 billion, a low near $864 billion, and a close close to $871 billion. Price continues to trade inside a defined support band.
This support zone has absorbed multiple tests following the October breakdown from the supply area. That breakdown led to a multi-week decline, with price remaining below the 20-day moving average throughout the slide. The moving average also capped rebounds during that period.
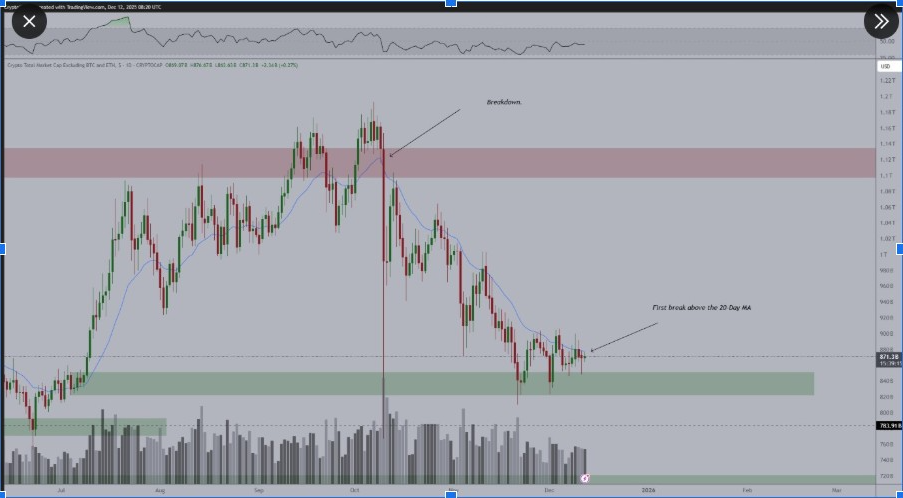
Recent candles now press into the 20-day moving average, with the chart showing the first clean close above it in weeks. While that move alone does not establish a new uptrend, it often marks a slowdown in downside momentum. It also provides traders with a reference point for a higher-low formation if support holds.
Volume and Momentum Reflect Consolidation Phase
Volume data adds context to the recent stabilization. The October decline printed higher volume spikes than the current trading range. That contrast suggests forced selling has eased, replaced by tighter consolidation. Current volume remains moderate, consistent with a market awaiting direction rather than accelerating lower.
Momentum indicators on the same chart remain near mid-range levels. They show neither extreme selling pressure nor buying conditions. This aligns with price clustering between roughly $860 billion and $900 billion, where both buyers and sellers continue to engage.
The largest test remains the prior supply zone between $1.10 trillion and $1.14 trillion. That area marked the October breakdown and continues to represent overhead supply. A return to that range would require sustained follow-through.
At the same time, the ratio against Bitcoin must remain above its breakout retest. These conditions define the current Altseason setup, with altcoins reclaiming support while awaiting confirmation.


