
 NEAR Protocol
 Bitcoin
 Puffer
 Hyperliquid
 ZKsync
 Pudgy Penguins
 Pearl
Pearl

The recent crypto market crash accelerated this week, with Bitcoin and most major altcoins remaining in a technical bear market.
This article explores the main reasons behind the ongoing crash. It highlights stablecoin outflows from exchanges and the upcoming Bank of Japan decision. It also examines technical factors driving the market decline.
Crypto Market Crash Coincided With the Falling Stablecoin Flows
Investors have shifted to a risk‑off sentiment, which is one main reason for the ongoing crypto market crash. Bitcoin and most altcoins remain in the red, reinforcing this cautious mood.
For example, the Crypto Fear and Greed Index has moved to the fear zone of 25, down from last week’s high of 29.
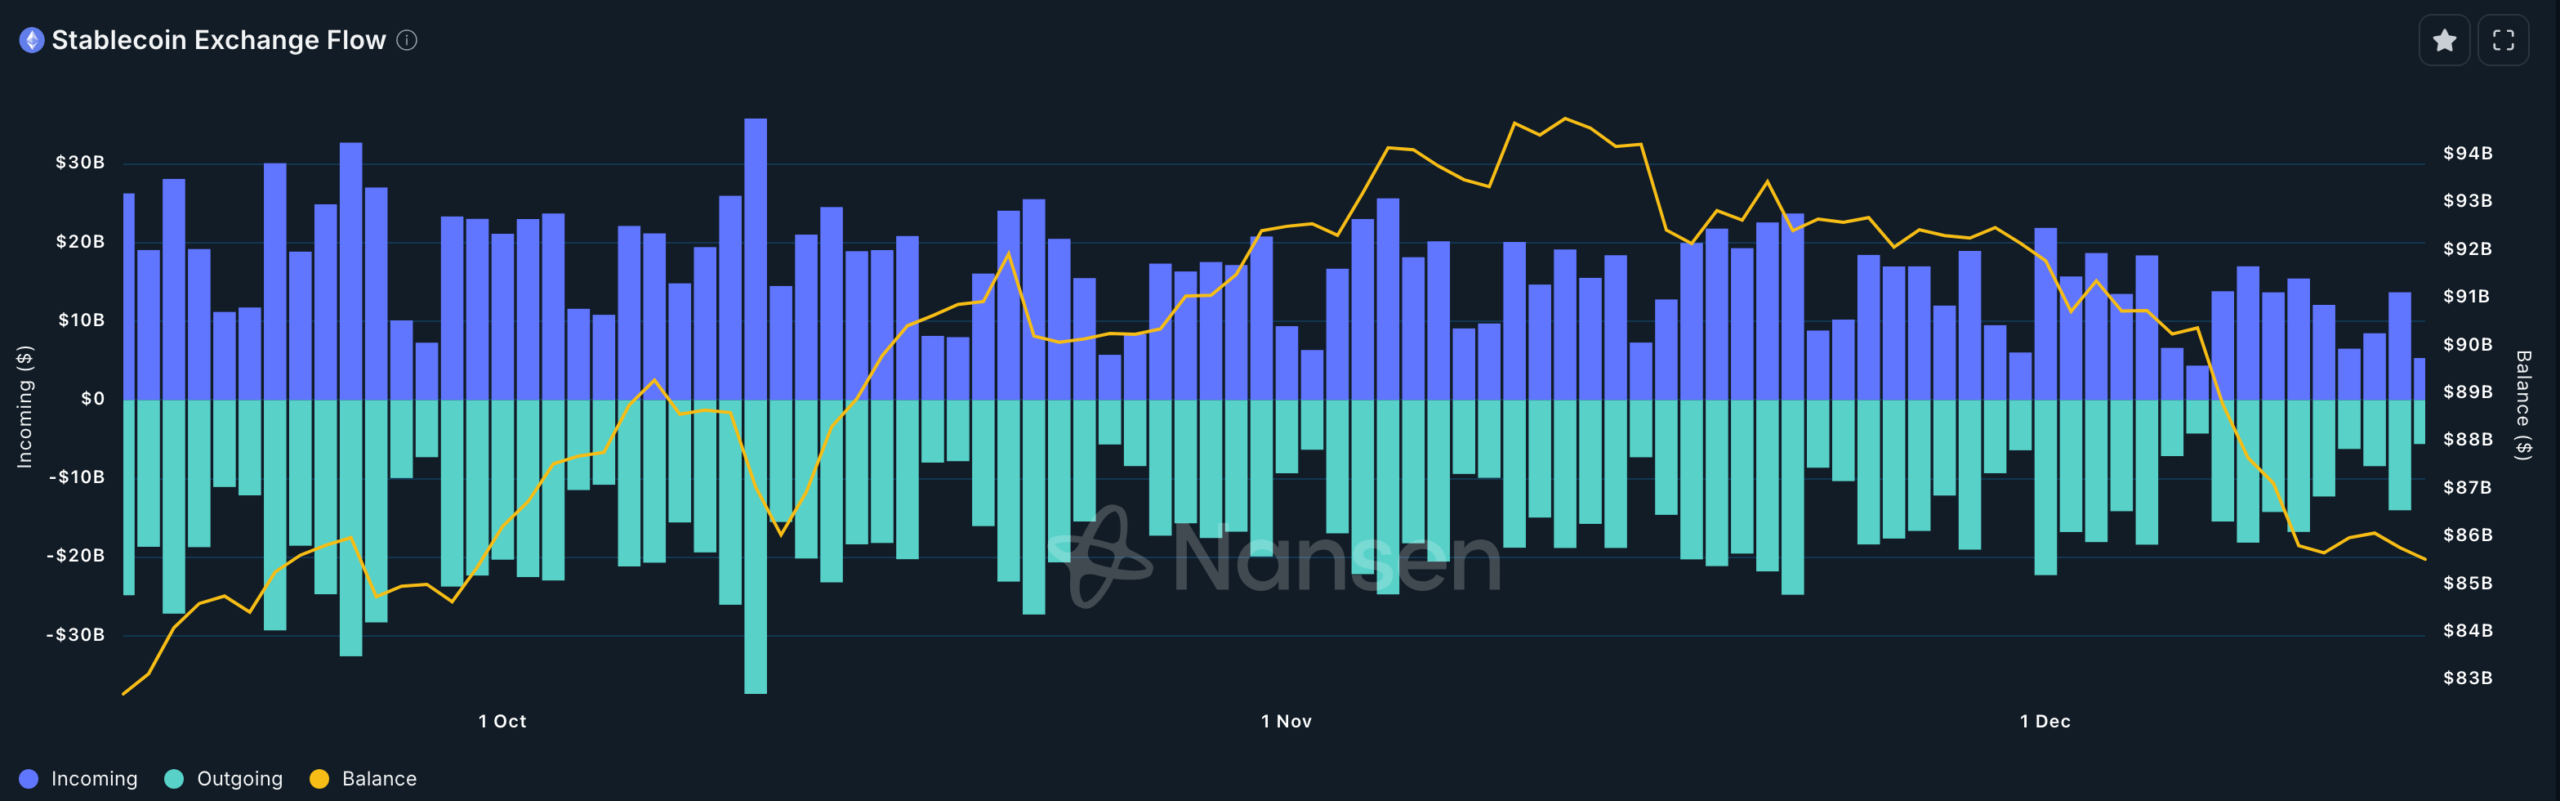
Another sign that the risk-off sentiment has prevailed is that stablecoins have been leaving exchanges in the past few weeks. Data by Nansen shows that the stablecoin exchange flow turned negative and reached its lowest level since October this year.
These stablecoin flows have moved from $94 billion on November 10 to the current $85 billion. Stablecoins are the currencies used in crypto trading as they bridge the on-chain and off-chain universes. In most cases, cryptocurrencies rise when the flows are positive, and vice versa.
Rising Liquidations and Falling Open Interest
Investors are continuing to reduce their leverage, showing clear risk‑off sentiment. This shift follows the large liquidation event on October 10. More than 1.6 million traders were wiped out during that crash.
They all lost over $20 billion in a single day after Donald Trump threatened new tariffs on China. Data from CoinGlass shows a 2.58% drop in crypto futures open interest in the past 24 hours.
The total has fallen to $130 billion. This decline adds to the broader risk‑off sentiment in the market.
The figure has continued falling recently, with any rebounds facing substantial resistance.
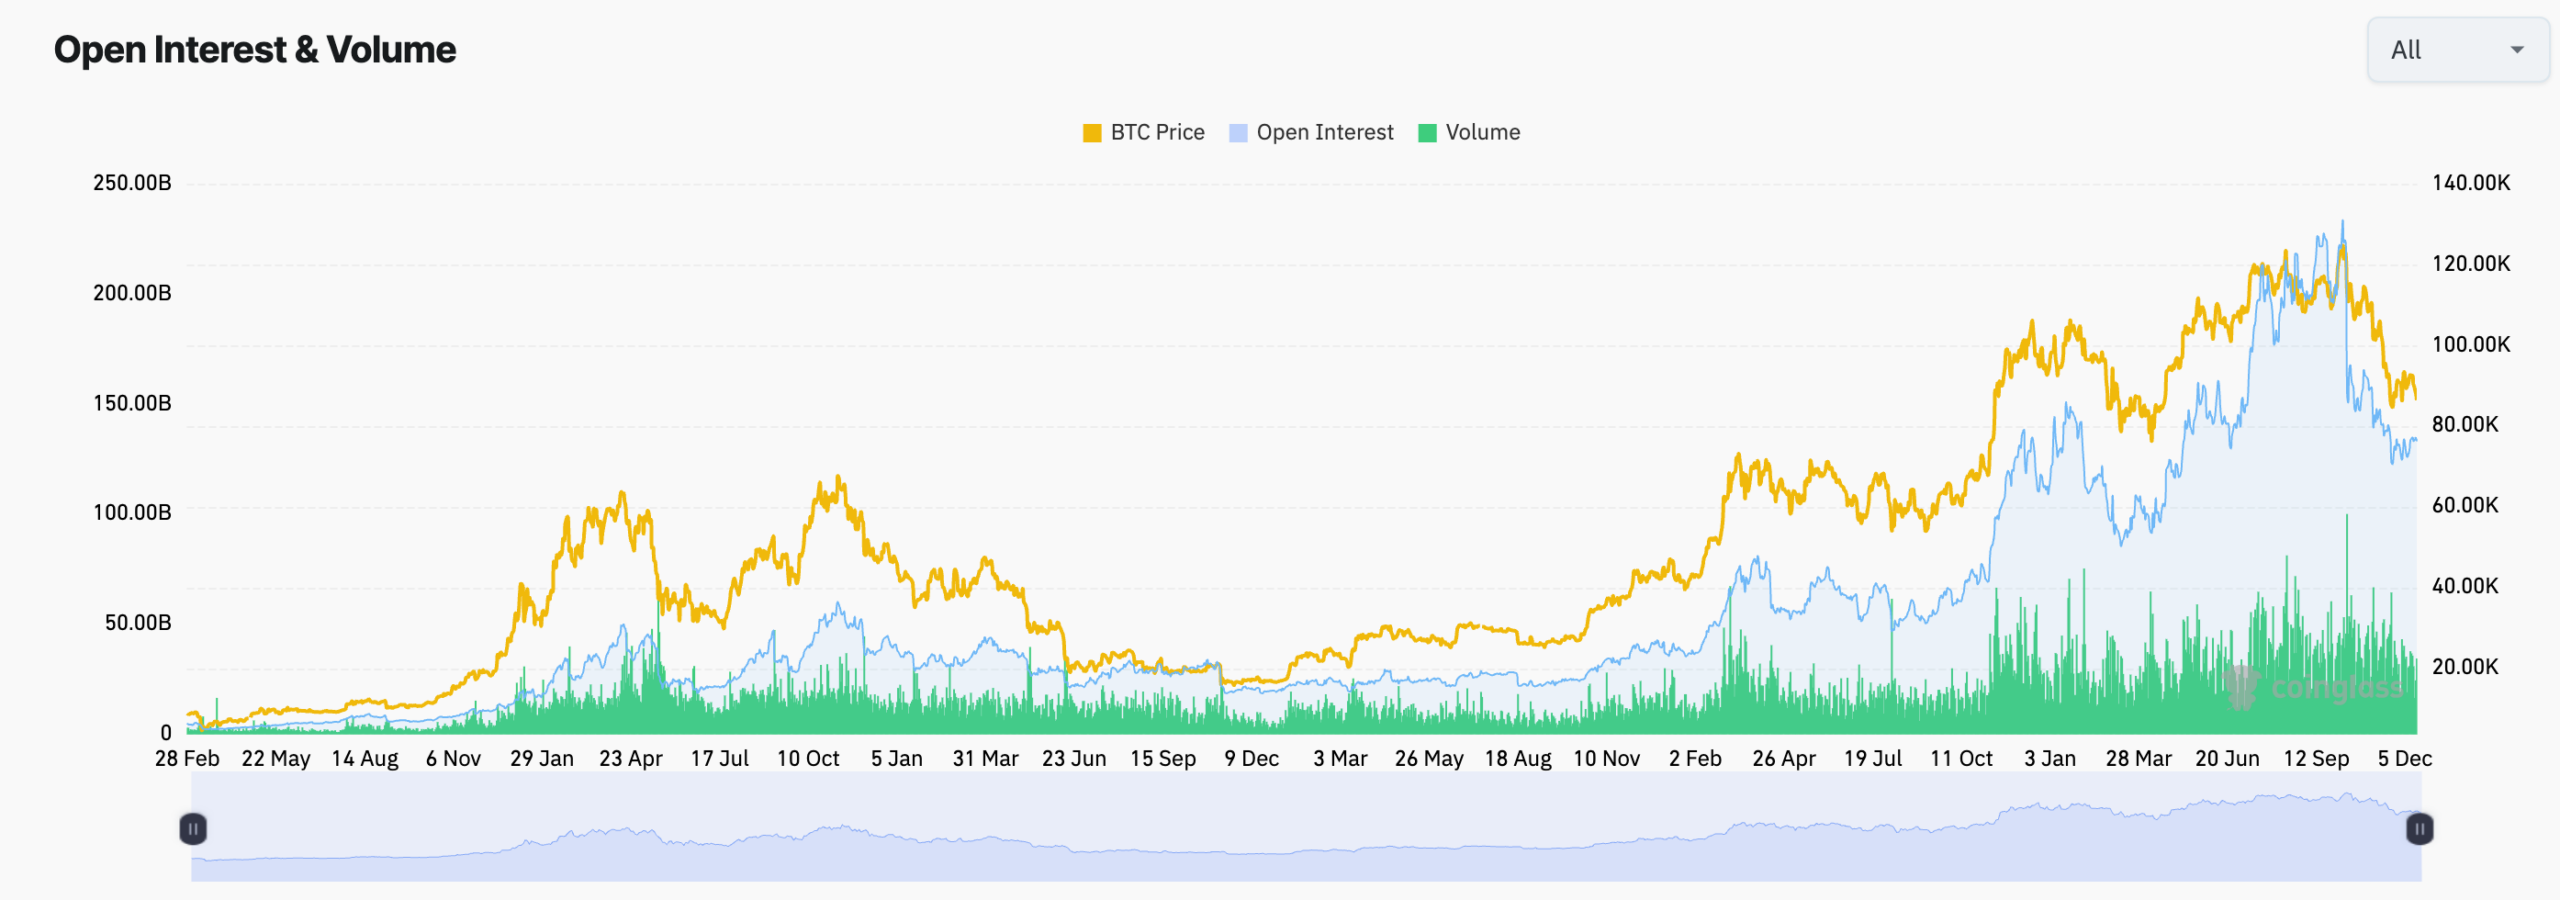
The ongoing futures open interest coincided with the rebound in liquidations. It soared by 125% to $667 million. The most liquidated tokens were Bitcoin and Ethereum.
Bitcoin and Ethereum Prices Bearish Flag Patterns
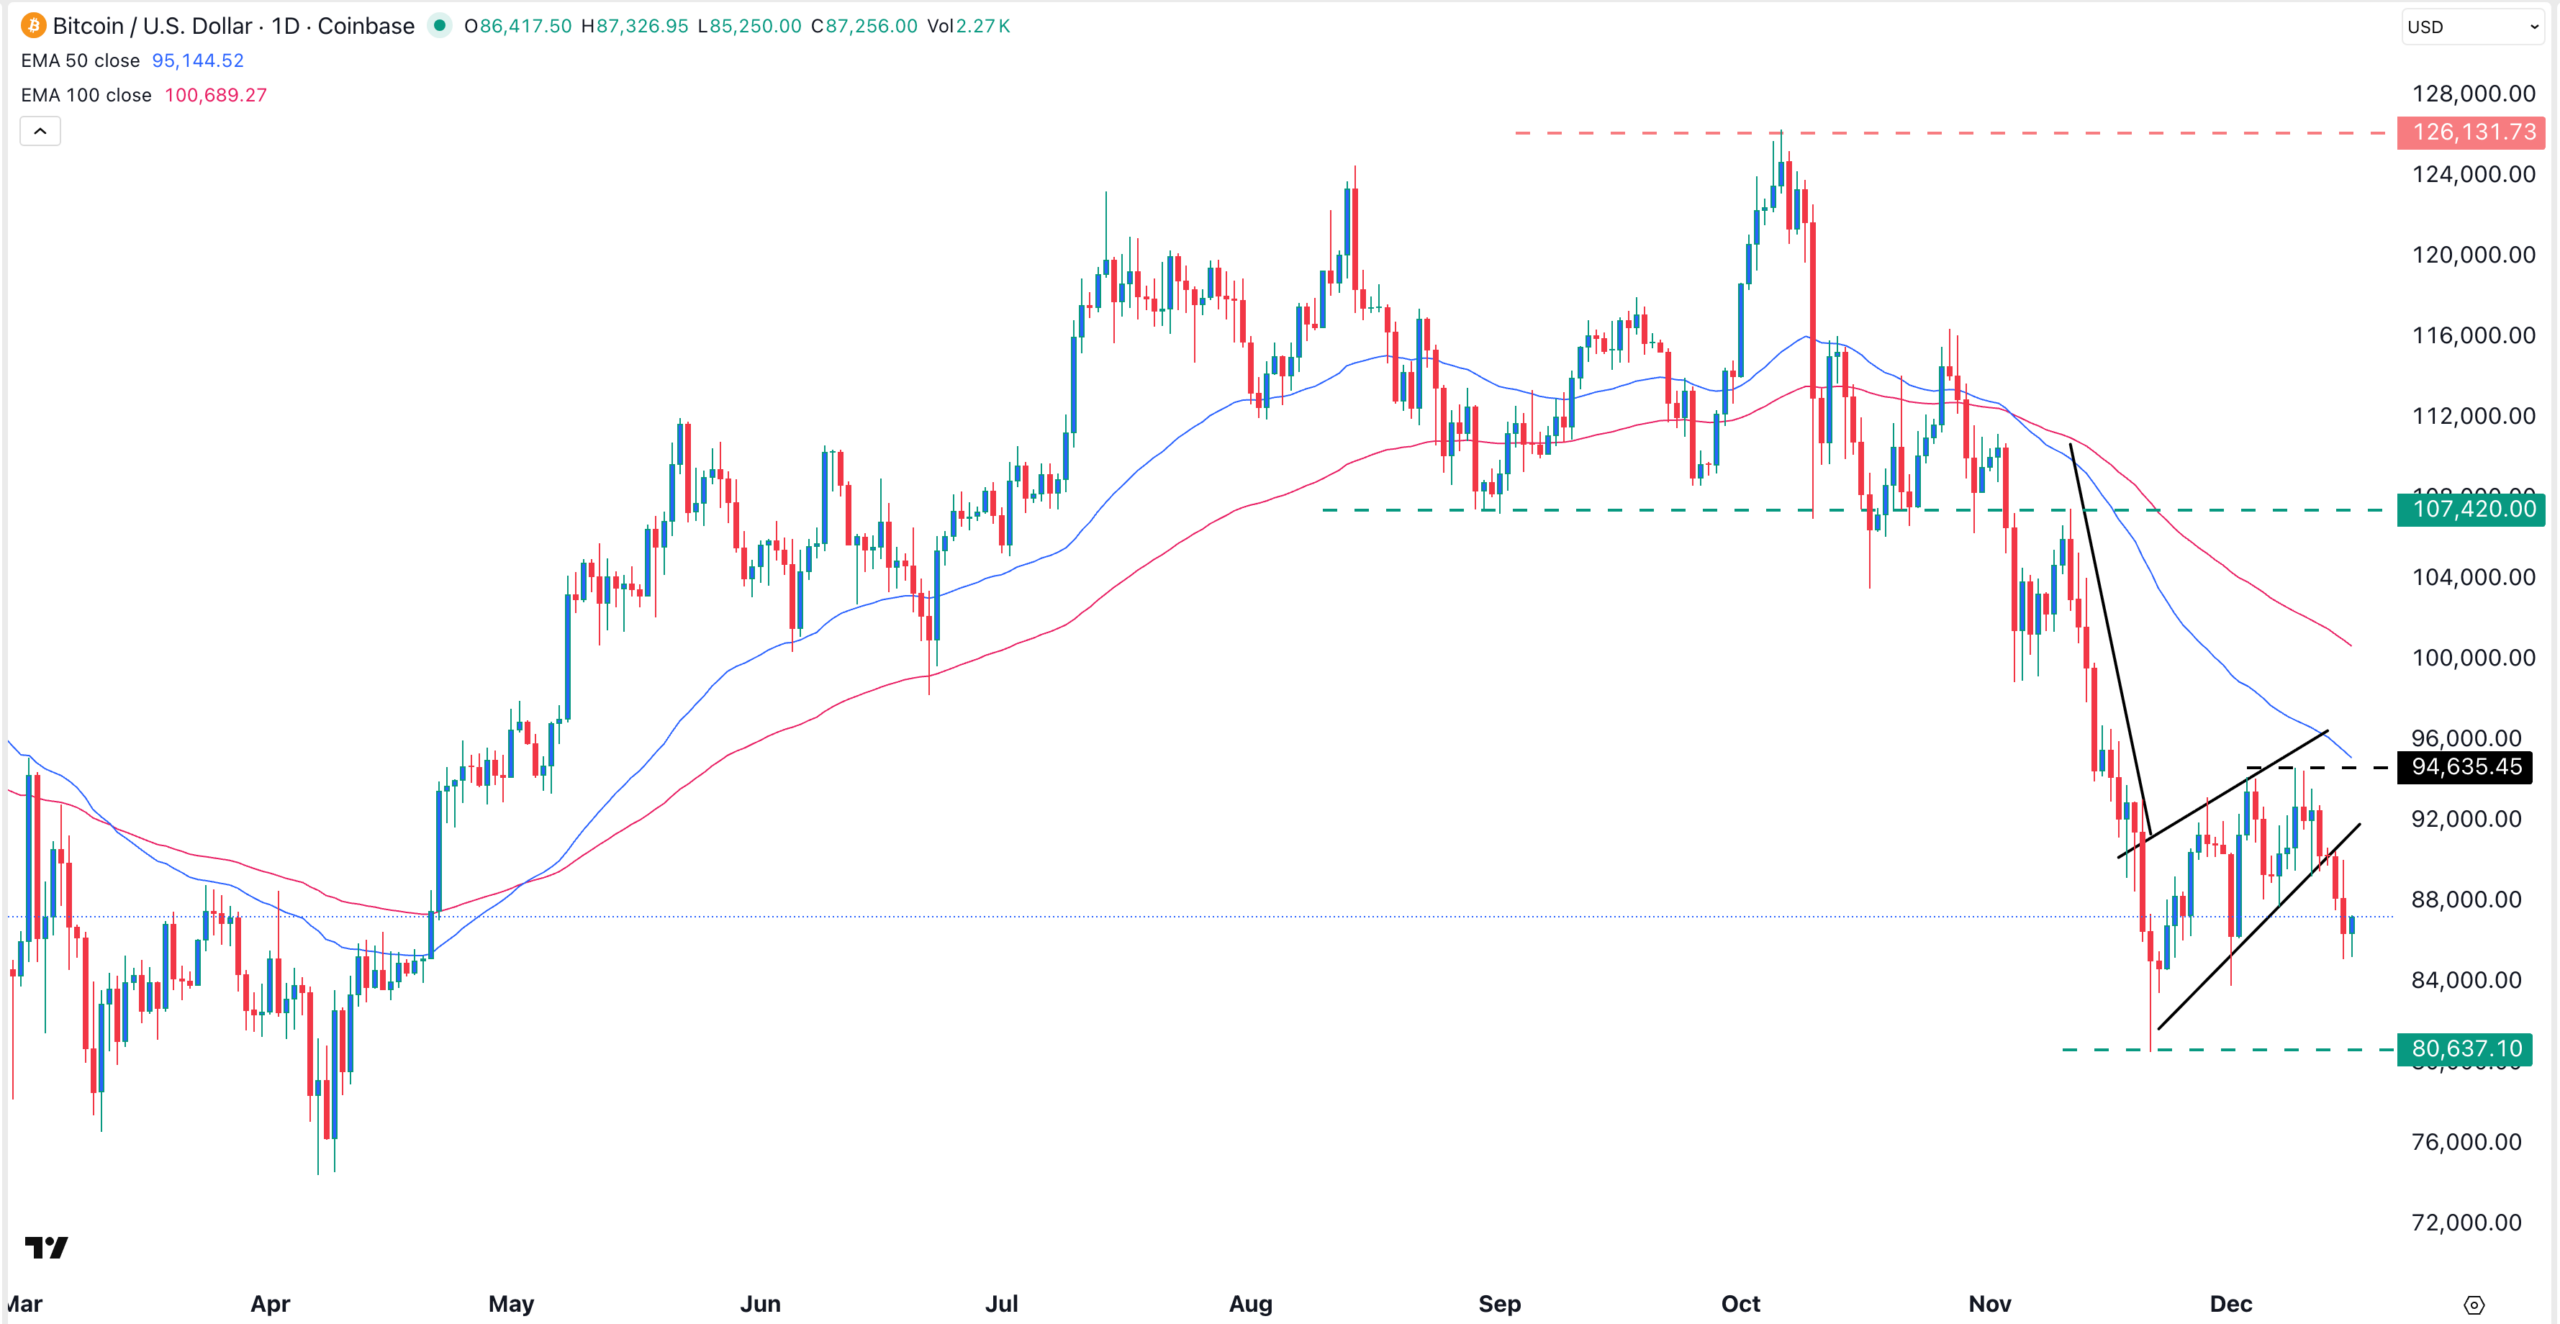
Technicals also explain why the ongoing crypto market crash is happening. The daily timeframe chart shows that the Bitcoin price has remained below the 50-day and 100-day EMAs since October 30.
It also formed a bearish flag pattern, which is made up of a vertical line and an ascending channel. It has now moved below the lower side of the flag pattern.
This means that it has more downside to go. This is important as most altcoins normally drop when Bitcoin is in a strong downward trend.
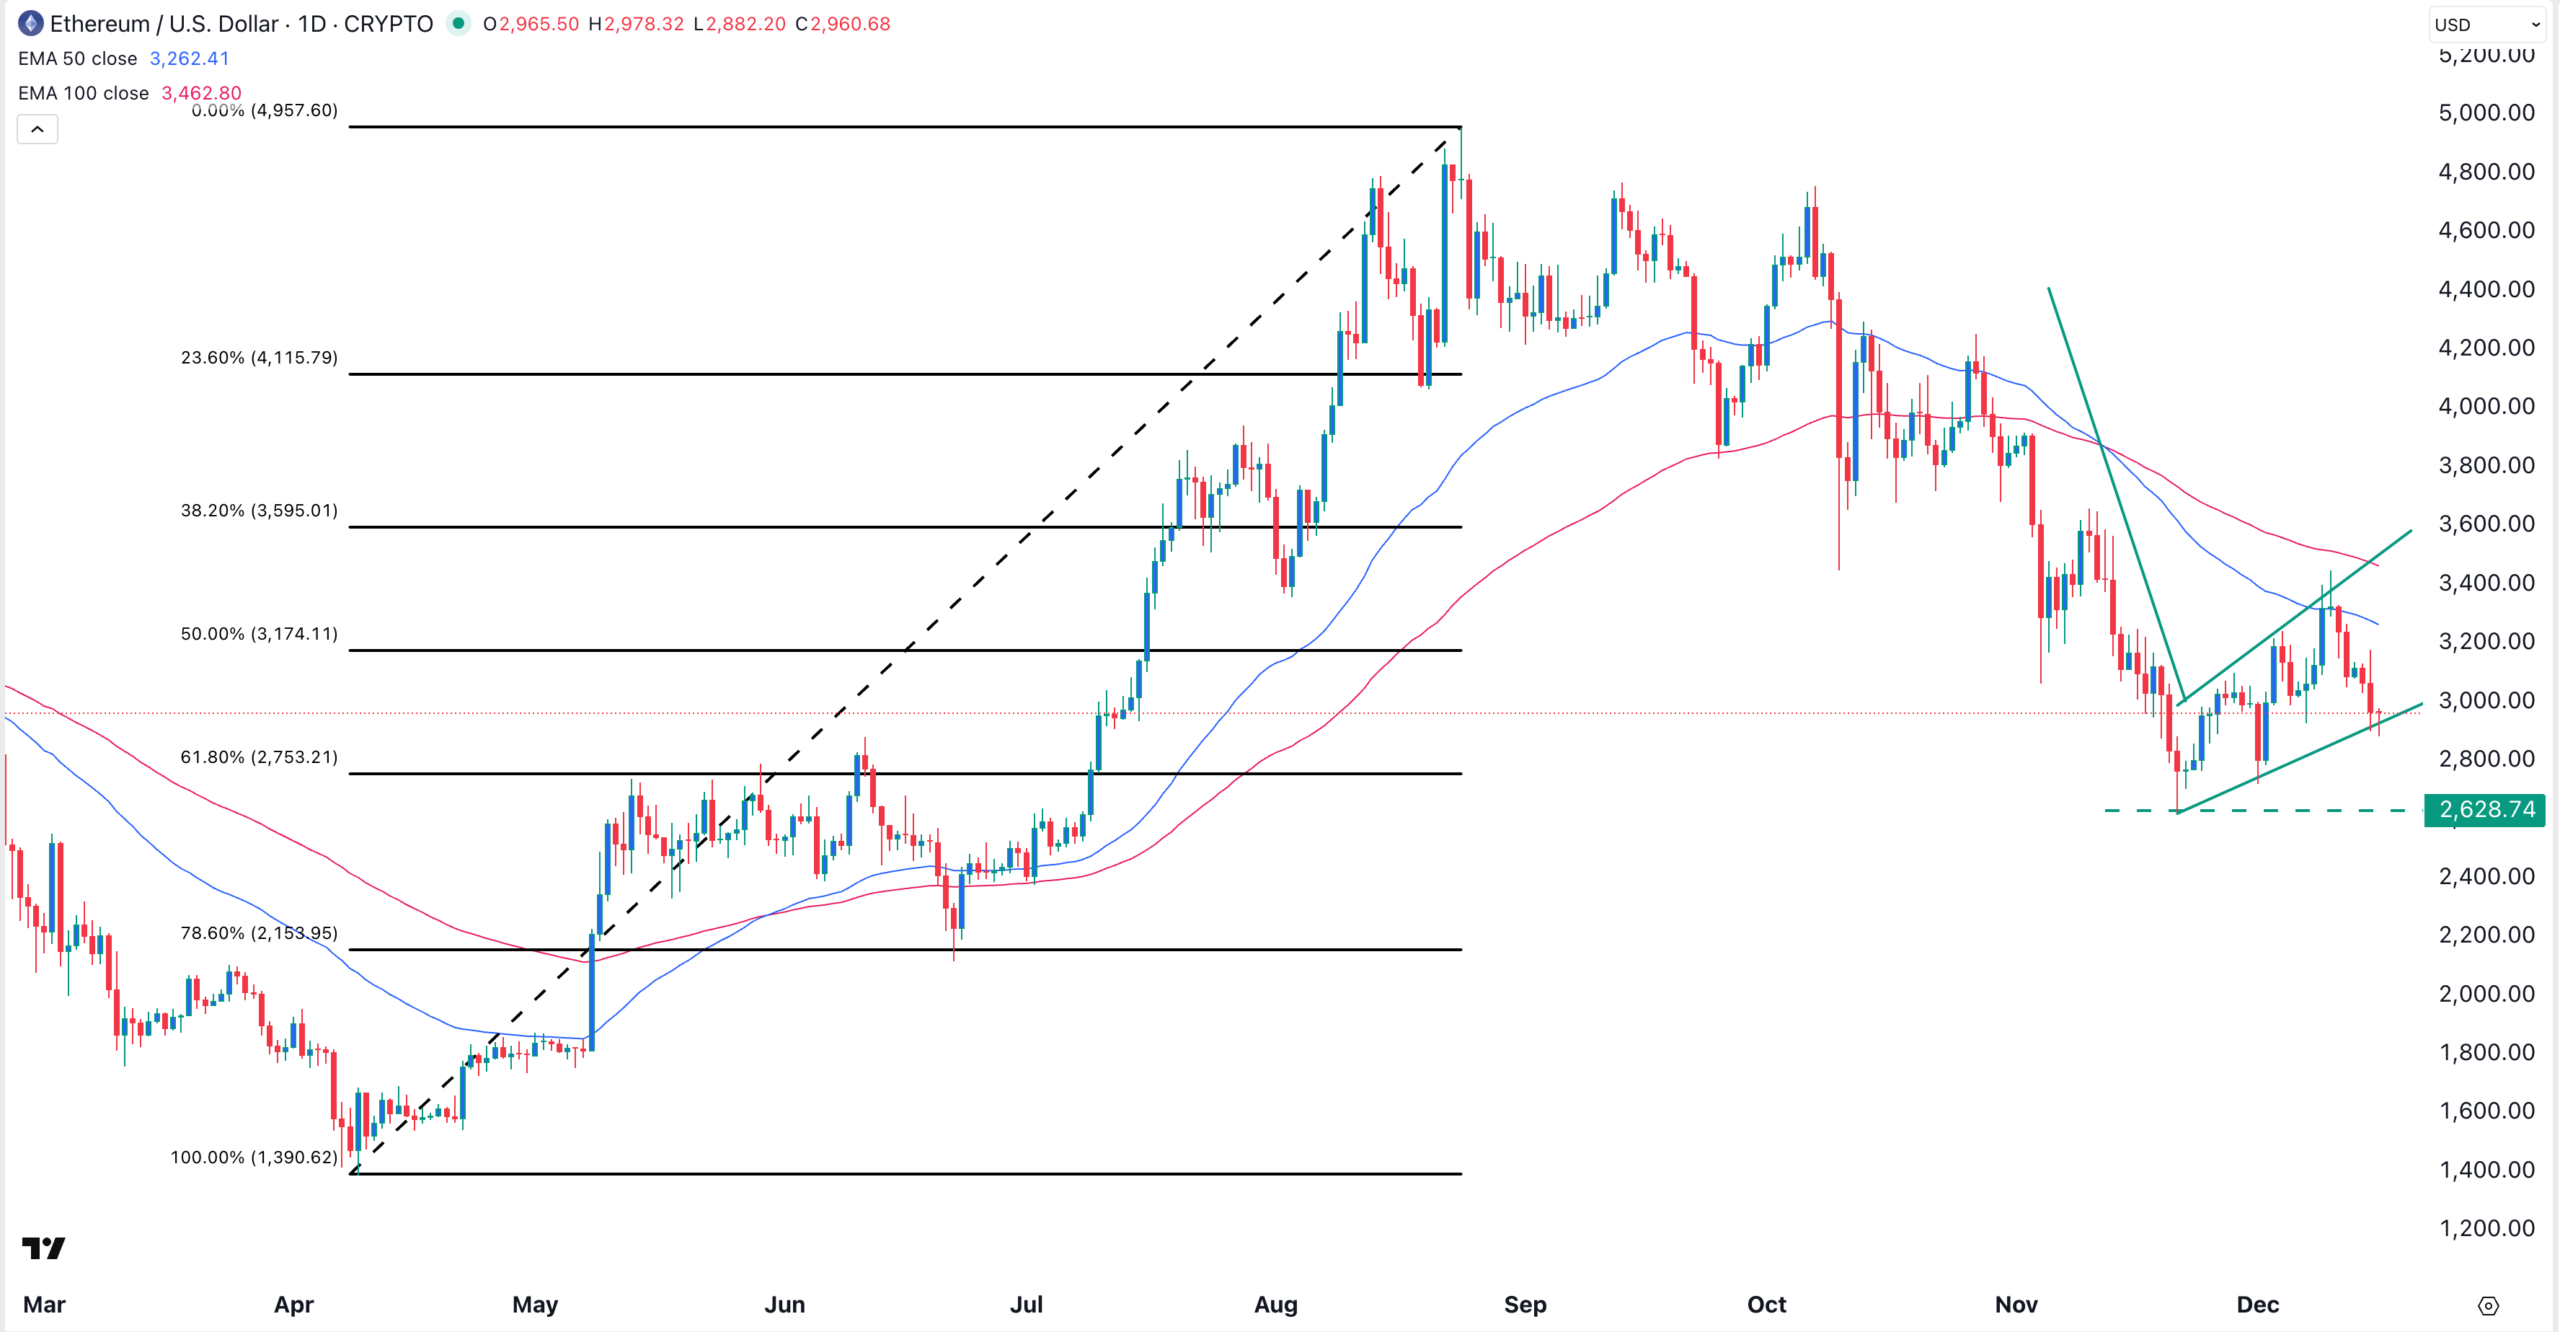
Like Bitcoin, the Ethereum price has also remained below all the moving averages. It recently dropped below the 50% Fibonacci Retracement level and formed a bearish flag pattern.
It is positioned alongside the lower side of this pattern, indicating that a strong bearish breakout may occur in the coming days.
Crypto Crash Triggered by the Upcoming BoJ Interest Rate Decision
The other main reason why the crypto market is crashing is that investors are waiting for the upcoming Bank of Japan interest rate decision, which often has an impact across most assets.
Most economists polled by Reuters and Bloomberg expect that the bank will hike interest rates by 0.25% to 0.75% as Kazuo Ueda, the governor, has hinted. Polymarket data shows that the odds of a rate hike have jumped to 98%.
A BoJ rate hike will be bearish for risky assets because investors have spent decades borrowing the yen cheaply and investing in risky assets.
Weak Bitcoin and Ethereum ETF Flows
Finally, there are signs of weak demand for Bitcoin and Ethereum ETFs from American ETFs. Data compiled by SoSoValue shows that Bitcoin ETFs shed over $357 million in assets on Monday, bringing their cumulative inflow to $57.5 billion.
Similarly, spot Ethereum ETFs shed over $224 million in inflows on Monday, the third consecutive day in the red. Other altcoin ETFs experienced little or no inflows on Monday as the crypto market crashed.



