
 astronaut
 Pearl
Pearl NEAR Protocol
 Walrus
 Zylo Ecosystem
 Bitcoin
 Hyperliquid

Ethereum price is consolidating after a strong advance. On‑chain cost data and several charts now cluster around the $3,000 zone.
CryptoQuant and TradingView show ETH price pressing into a range while support forms between $2.6K and $2.8K.
Whale Cost Basis Near $3,000 to Determine Ethereum Price Prediction
CryptoQuant’s “ETH Realized Price for Accumulation Addresses” plots the ETH spot price against a rising realized-price line. The realized-price curve trends higher across 2024 and 2025. It also sits close to the $3,000 area in the latest segment of the chart.
Master of Crypto said accumulation-style whale addresses have been buying steadily since June. According to the analyst, the ETH whale’s average buy price rose from about $1,560 in June to nearly $3,000. This placed that level as a cost-basis reference.
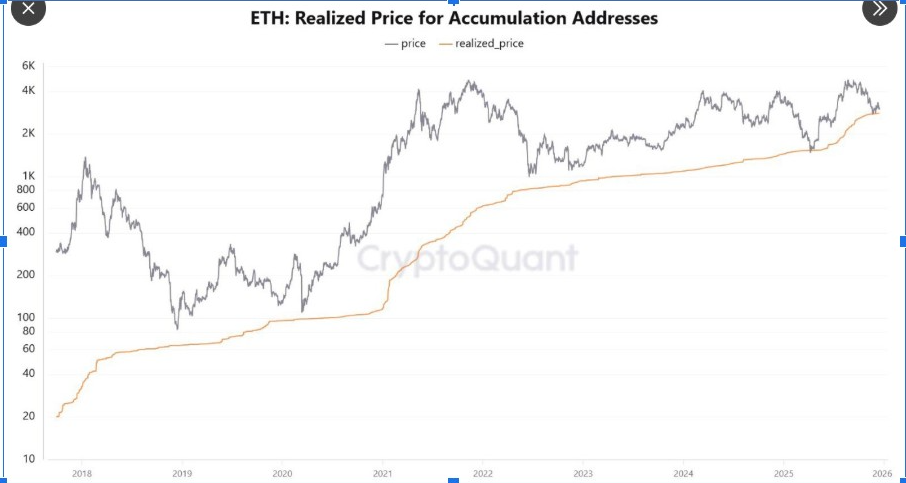
Historically, whales protect their average buy level, as the analyst framed ongoing buying as support for that zone. The chart shows spot price moving around the realized-price line at different points. With this, the latest reading places the Ethereum price prediction near that curve.
ETH Price Remains Range-bound
A separate Ethereum price prediction marked $3,000 as the key level to reclaim. The analysis shows ETH trading around $2,931, with nearby marked prices around $2,859 and $2,825.
The same view states that failure to reclaim $3,000 could open a move below $2,800. A dashed red line sits under the $3,000 band, mapping the area where the ETH price has stalled.
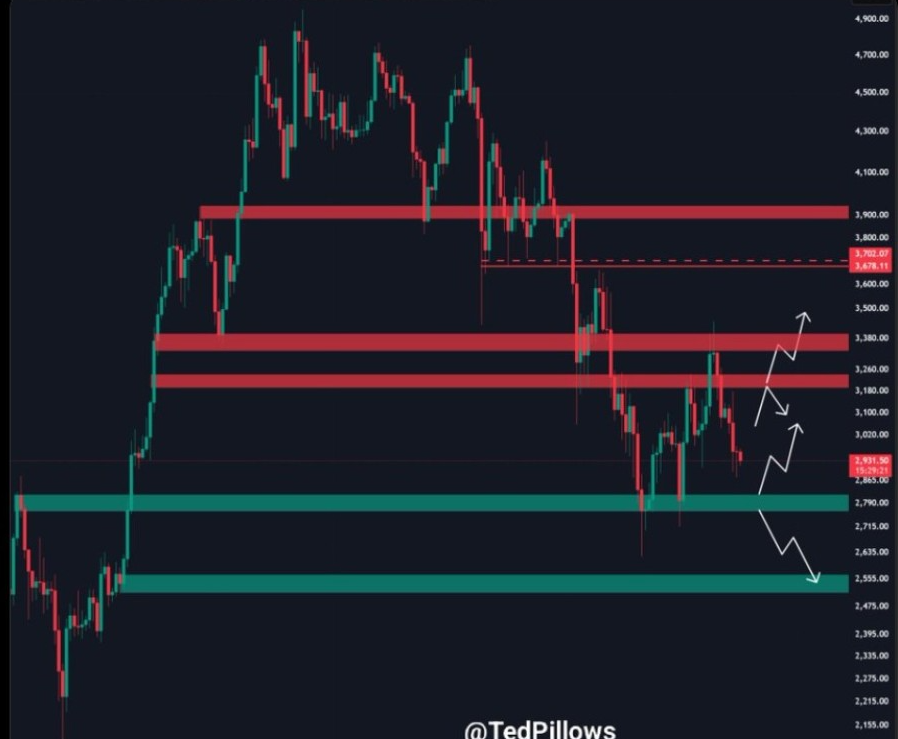
The chart uses horizontal bands to map supply and demand zones that price has reacted to repeatedly. A red band appears near the $3,000 region, and additional red zones sit higher on the chart.
Green demand bands sit below the current price and align with the $2.8K area. On the other hand, a deeper band is plotted near $2,555.
Ethereum price prediction also includes directional arrows that trace paths toward higher resistance bands or toward lower support bands.
Rising-wedge Breakdown Points to $2.8K Support zone
A TradingView analysis shows Ethereum price breaking down from a rising wedge after an expansion phase. Following the break, the chart showed ETH compressing and drifting back toward a boxed support area.
The analyst identified the retest region as $2.6K–$2.8K, describing it as a level that attracted demand in prior cycles. The same chart includes a higher horizontal marker near $5,001, tied to a prior peak area.
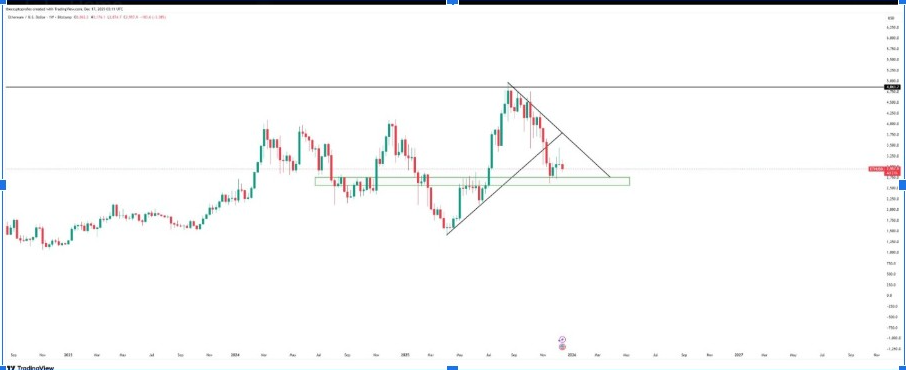
On the chart, the wedge boundaries tighten into a peak. After that, the ETH price moves lower and returns to the highlighted base.
More so, the ETH range chart plots multiple resistance levels above the current Ethereum price. One resistance area is marked around $3,260–$3,380, while another appears near $3,678–$3,702.
Therefore, if the Ethereum price moves above $3,000, it places $3,260–$3,380 in view. This was followed by $3,678–$3,702 and $3,900. Concurrently, ETH trend below $2,800, shift focus to $2.6K–$2.8K, then the $2,555 band.
Ethereum price recovered over the last 24 hours, rising from around $2,900 to about $2,947. It also held near the $2,929 pivot, keeping $3,000 in focus as the next reclaim level.



