astronaut
 Pearl
Pearl Zylo Ecosystem
 Bitcoin
 Bitway
 NEAR Protocol
 Zcash
Zcash
Solana price trades close to a significant support zone as technical pressure continues to build. While network activity remains strong, momentum indicators suggest increasing downside risk.
As a result, SOL price prediction now focuses on whether or not the $125 level will be able to hold.
Solana Price Trades Around a Long-Term Support
Solana price is trading just above the $125 support area, which has been defended since early 2024. This range has absorbed selling pressure several times during the broader market pullbacks. However, the current test shows weaker reactions than previous rebounds.
Over the past year, SOL has been trading in a wide-range of $125 to $250. Although the price temporarily crossed out of this band, it kept returning inside the band. That behavior reinforced $125 as a critical floor in the structure.
The latest rejection followed a failed recovery attempt in September. Since then, the Solana price has moved steadily downwards. Unlike previous declines, the price broke below the range midpoint without any meaningful bounce.
Weekly candles are now showing sustained bearish control. The last three closes have been kept red. This pattern indicates that the sellers are still in control of near support.
Momentum Indicators Signal Increased Downside Risk
Technical indicators support the bearish Solana price prediction. On the weekly chart, there is still a weak momentum across several signals. These conditions make a near term recovery less likely.
The Relative Strength Index is still below the 50 level. This reading means bearish momentum and not consolidation. Historically, SOL has trouble bouncing around with RSI below this mark.
Also, the Moving Average Convergence Divergence stays negative. No bullish crossover has been created yet. This confirms no trend reversal signals.
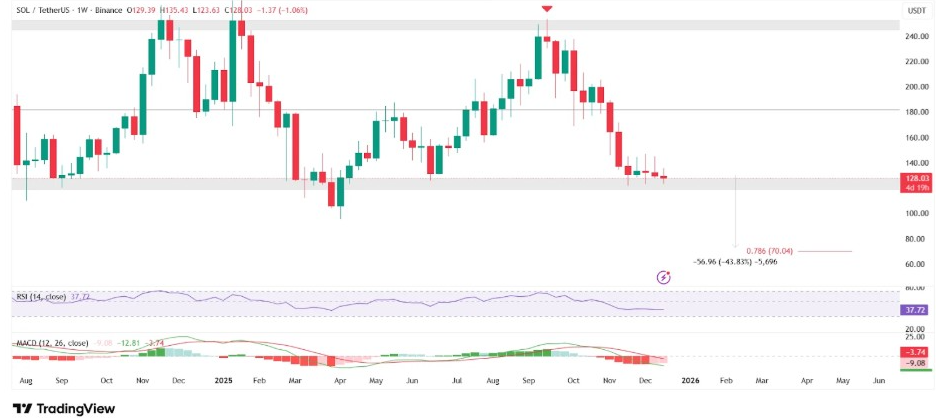
Analysts note that breakdowns from this structure often occur quickly. With no nearby horizontal support, the price could move rapidly once $125 fails. That scenario presents downside towards deeper Fibonacci retracement levels.
If selling pressure increases, a move below the $70 region could be possible for SOL. This level is in line with the 0.786 retracement from the previous cycle. Such a move would amount to a decline of over 45%.
Short-Term Charts Point to a Potential Breakdown
More so, a lower-timeframe structure added more pressure to the Solana price prediction. On the six-hour chart, SOL is trading within an ascending parallel channel. This formation usually indicates a corrective phase and not a trend continuation.
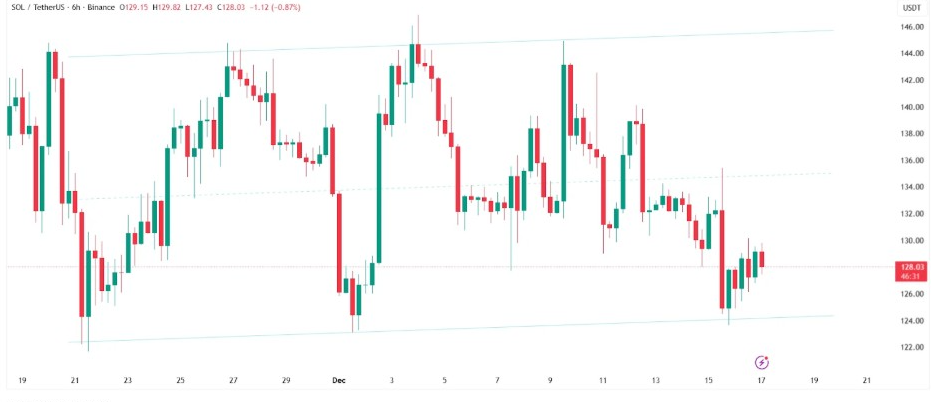
Price is currently in the lower half of the channel. That positioning is reflective of persistent selling into minor rebounds. Bounces have become smaller with each attempt.
Once SOL drops below the channel, there is a higher risk of confluence. A breakdown of the channel would coincide with a loss of the $125 support. This is a strong reinforcement for the bearish case.
Ali Charts recently pointed out this setup on the four-hour timeframe. According to the analysis, SOL has tested the $124 support three times. Repeated tests without intense rebounds are often a precursor to breakdowns.
The analyst identified two potential paths. Holding above $124 could be a move towards $150 to $160. However, a failure would likely send SOL below $100 and lower.
Strong Network Activity Fails to Offset Price Pressure
Despite the technical weakness, Solana network metrics have been strong. The blockchain remains on top of all chains in terms of DEX volume and app revenue. Recent data positioned Solana in the #1 spot for 24-hour, 7-day, and 30-day charts.
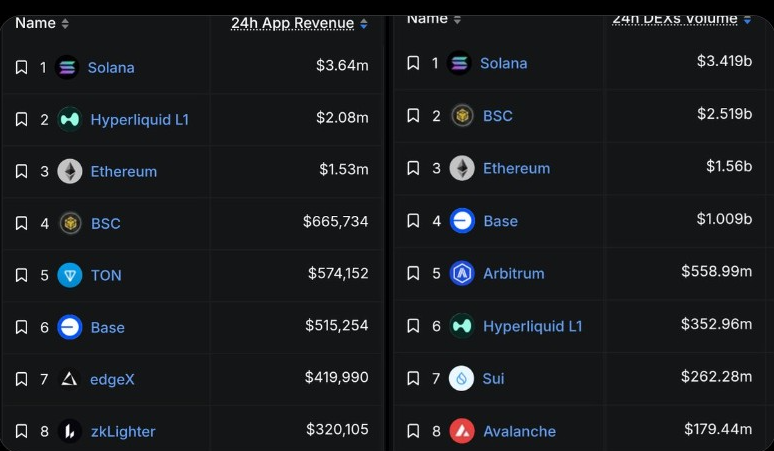
Daily decentralized application revenue was more than $3.6 million. DEX volume peaked at $3.4 billion over the same period. These figures surpassed Ethereum, Base, and BSC.
Such activity underscored the disconnect between usage and price. Strong fundamentals have not turned into immediate price support. This divergence often manifests itself during wider corrective phases.
Solana has lost over 10% in its price in the past month. That decline happened despite an increase in on-chain engagement. It implies that macro sentiment and technical structure continue to be dominant drivers.
For now, charts demonstrate that the downside risk outweighs the upside potential. There is still a chance for a bounce at $125 if the buyers can defend it. However, failure would likely have the $100 level in firm focus.