Boomer
 hi
hi Covenant x402
 NEAR Protocol
 Injective
 Quantus
 Solana
- MIOTA price is currently on a downtrend with a loss of 0.79% in the intraday session. The price can break the support in upcoming days
- Technical indicators for IOTA hints a bearish momentum in the price. Meanwhile the IOTA/BTC pair is seeing a downtrend with a loss of 0.88%.
IOTA price is trailing at $1.94 with an intraday loss of 0.8%. The price can face resistance on the upside at $2.5. On the downside, a bounceback can be expected from $1.5. IOTA has seen more than 400% from the start of the year. It is currently trading above 50 and 100 Daily Moving average. The 50-MA (red line) is at $1.84 making it temporary support for the price.It can see a negative crossover from 50MA in the upcoming trading sessions. It may push the price to lower levels. MIOTA is currently ranked at 36th in the crypto-verse with a market capitalization of $.$5,393,367,620.07. The trading volume of the coin went down by 33% in 24 hours. Volume to market capitalization ratio for the coin is 0.03,which shows a downtrend in price.
Technical Indicators Hints A Downtrend For IOTA Price
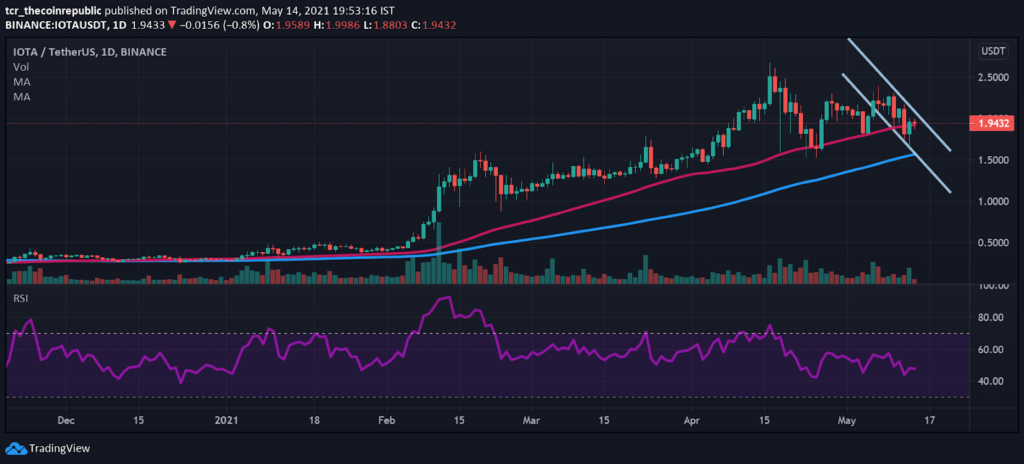
The weekly technical chart of IOTA shows a bearish momentum in the price. On the daily chart the price of the coin is seeing a weak downtrend.The price has formed a downside parallel channel on the daily chart.If the price breaks 15% above the parallel channel then a robust bullish momentum can be seen. IOTA/BTC pair might also see a downside correction in the upcoming days.
The volume indicator on the daily chart is at 13.28M, with a small selling pressure. If the price goes below $ 1.5 than a strong downtrend can be seen
RSI(Bearish): It is currently trailing at 48.61, highlighting its presence in the neutral zone. There is a negative slope formation in the RSI. It showcases that price might see a downtrend. The overall sentiment of the RSI is bearish
Conclusion
IOTA price has seen a significant jump in the last few months. The price is currently in a slump but can soon see a recovery. IOTA/BTC pair can also see a great returns in upcoming days. An Investor should do their due diligence before investing
TECHNICAL LEVELS
Major Support:$1.5
Major Resistance:$2.5