
 Walrus
 Quantus
 Pudgy Penguins
 Bitway
 Quant
Quant Sui
Sui Bitcoin

Solana price is nearing a decisive technical zone, with traders weighing up the breakout momentum and downside risk. Several analysts highlight obvious levels that may influence short-term direction and overall trend structure. Current positioning reflects increasing optimism, but resistance is still unresolved.
Solana Price Tests Key Daily Resistance
Solana price action on the daily timeframe showed an important inflection zone around $144.63. This level aligned with a previous range high that violently capped upside attempts. Ali Martinez stated that failure to recover $144.63 could lead to a pullback to $131.53. His chart shows price compressing below resistance, with momentum slowing down into rejection wicks.
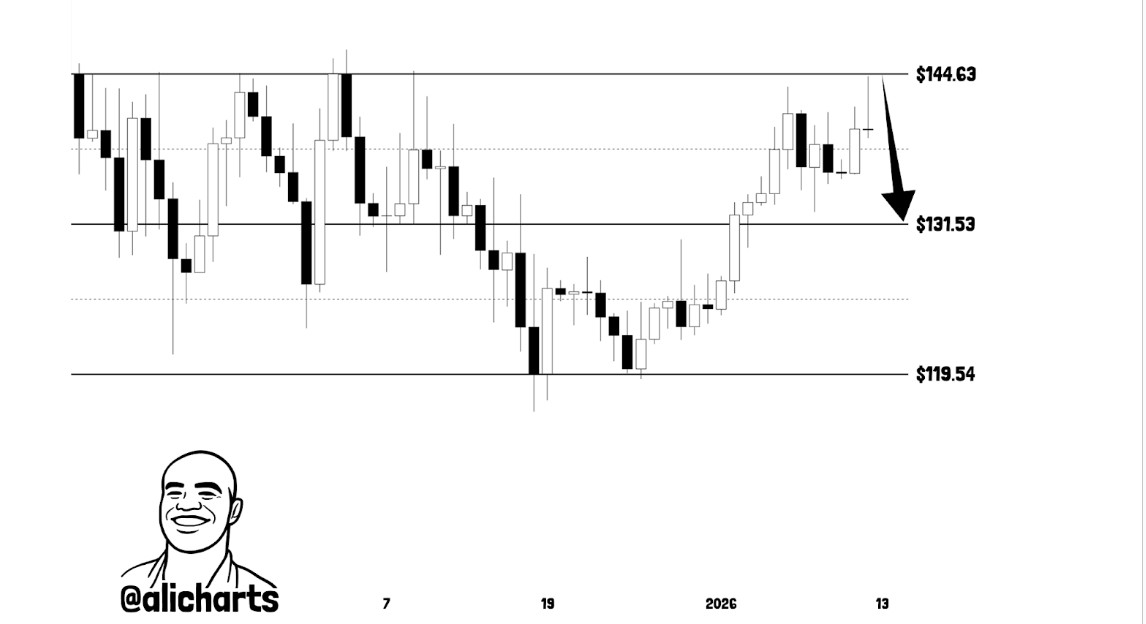
The structure represented a broader range of $119.54- $144.63. This range has characterized Solana price trend since late 2025.
Repeated failures near the upper boundary indicate that supply is still active. However, the higher lows since December indicate demand has not collapsed.
Martinez said that a close above $144.63 daily would invalidate the pullback scenario. Such a move could open the way again to higher resistance zones. Until then, Solana price is prone to rotation within the range. Traders are watching the volume behavior near the range high.
Pullback Scenario Outlines $131 Support
Another view holds that a controlled retracement may reinforce the bullish structure. Crypto Tony set out a scenario in which Solana price hits the $131 support zone again.
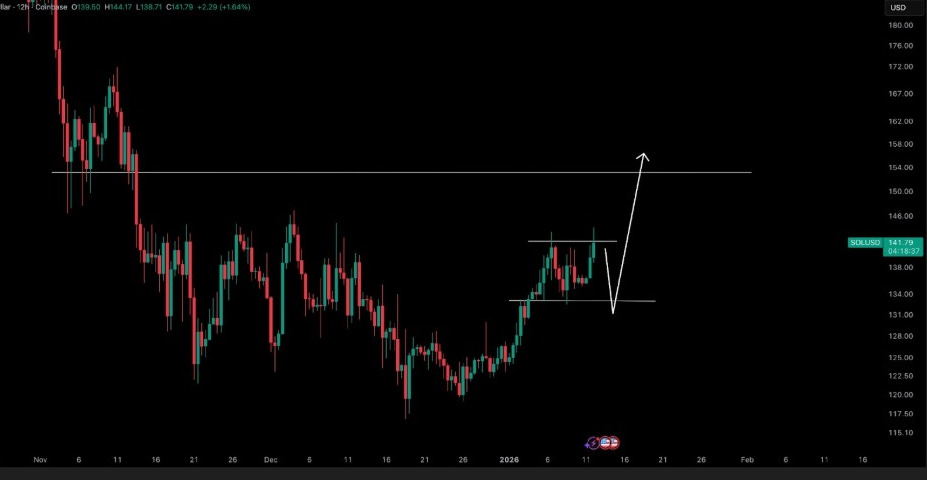
He described this level as a former resistance turned into demand. A clean retest may reset momentum and bring in new buyers. According to his chart, rejection at around $143 would likely be followed by the move lower. This rejection would confirm the short-term exhaustion rather than trend failure.
Crypto Tony emphasized how such pullbacks are normal in the development of uptrends.
They tend to flush late, long before continuation towards higher resistance.
His upside target is not far from the $150 resistance zone. That area previously served as a major level of breakdown. If reclaimed, the market structure would change decisively bullish. Solana price could then go on to test wider weekly resistance levels.
Derivatives Data Favors Bullish Positioning
Beyond price structure, derivatives data discloses considerable directional bias. CW revealed a massive advantage in long positions across major exchanges.
Liquidation heatmaps revealed heavy short-side liquidity above current levels. This positioning hints that upwards moves may set off cascading short liquidations.
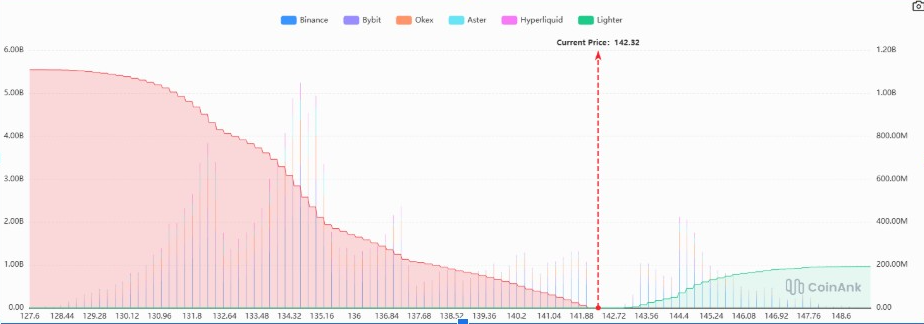
The data showed that downside liquidity has thinned significantly. Most of the forced selling seems to have already been absorbed at around $130 to $135. CW commented that long dominance does not mean immediate upside. However, it lowers the likelihood of sharp downside continuation.
As long positions develop, spot-driven pullbacks can be shallow. This dynamic is supporting higher lows in Solana price action.
Funding rates are still high, but not extreme. This balance implies optimism, but without too much leverage risk.
Long-term Structure Targets a Higher Range
Rose Premium Signals set out a longer-term roadmap. Their analysis focuses on a weekly structure that has been in place since early 2025. The chart showed a long accumulation zone between $106 and $135. This zone has received repeated sell-offs without structural breakdown.
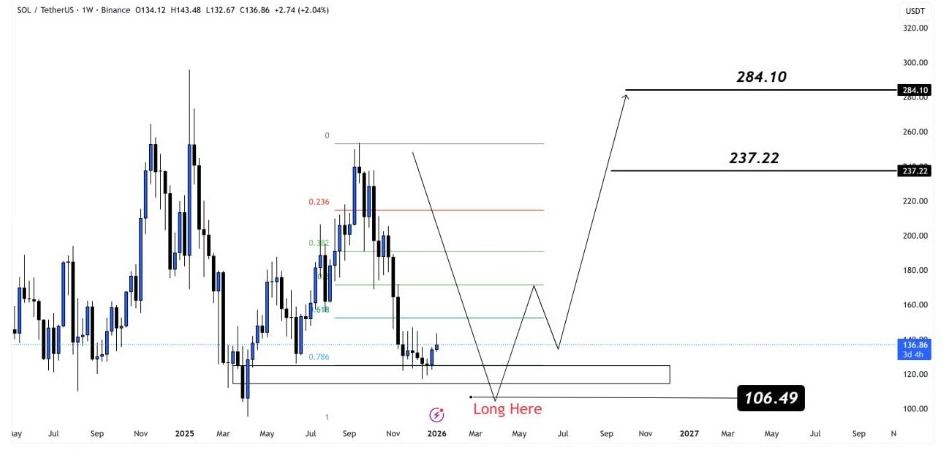
Rose Premium Signals projected upside targets at $237 and $284. These levels correspond with previous weekly supply and measured expansion ranges.
The analyst emphasized the importance of patience rather than immediate breakout hopes. Price could consolidate for months before acceleration starts. Their projection assumes that the macro conditions will continue to be supportive of risk assets. Sustained demand and ecosystem activity are key assumptions. If confirmed, Solana price could head from a recovery into expansion.


