
 Pearl
Pearl Bitway
 Zcash
Zcash Walrus
 Aerodrome Finance
 Starknet
 NEAR Protocol

XRP price is consolidating above the $2.00 level after rebounding from a support zone near $2.04. On the 4-hour chart, the Ripple token moved back above its short-term moving average, a common marker of improving intraday structure. More so, on-chain holder positioning has also shifted toward accumulation, while a reversal pattern continues to form on XRP/USDT.
XRP Price Prediction: Key Levels Define the Current Range Above $2
On the 4-hour XRP/USD chart, the $2.04 area served as a near-term demand zone, where the price stabilized after a pullback. The bounce occurred near a Fibonacci retracement level, reinforcing that region as technical support. Since then, XRP price held a tighter range that keeps trading concentrated above $2.00, with buyers defending the $2.00–$2.04 band.
A deeper support base is visible near $1.92 to $1.95, which previously hosted an extended period of consolidation before the latest advance. If XRP price revisits that area, the zone represents prior balance rather than a single candle-based level. In the current structure, these stacked supports help define where downside tests have historically attracted liquidity.
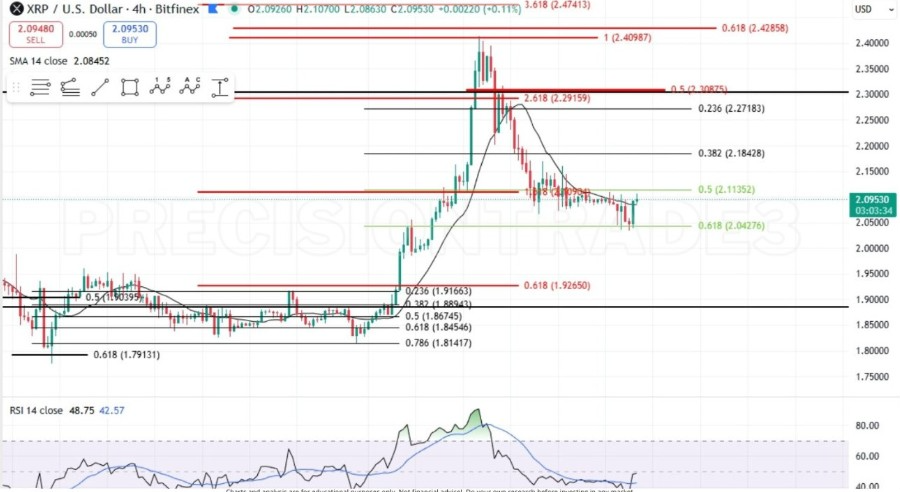
Overhead, resistance is concentrated near $2.11, where prior reactions and horizontal structure intersect. Fibonacci mapping places additional supply between $2.29 and $2.32, aligned with a 2.618 extension on the chart view, while another cluster sits around $2.41 to $2.43, matching a 0.618 retracement of a broader swing.
These zones previously attracted sharp wicks and fast two-way trading, keeping them central reference points for short-term XRP price prediction tracking. With price between $2.00 support and $2.11 resistance, the near-term direction is being set by repeated tests closely of both edges.
Momentum Indicators Improve as Trend Conditions Stabilize
Momentum readings on the 4-hour chart have rotated higher, with the Relative Strength Index (RSI) rising from neutral territory. The move signals stronger buying pressure than during the pullback while staying below the overbought band shown on the chart scale. RSI strength near the midline often aligns with stabilization rather than a one-direction trend.
Price also reclaimed its short-term moving average after trading below it during the corrective phase. Holding above this level is commonly used as an intraday trend filter, and it matches the shift into consolidation above $2.00. Recent candles have also narrowed compared to the earlier selloff segment, reflecting a contraction in volatility.
Long-Term Holders Added About 720M XRP in 3 Days
Moreover, on-chain data tracking shows a renewed accumulation phase among XRP holders over the recent three-day period, as indicated by the change in net position. The dataset indicates long-term holders added roughly 720 million XRP, with net positioning flipping from negative to sustained positive bars.
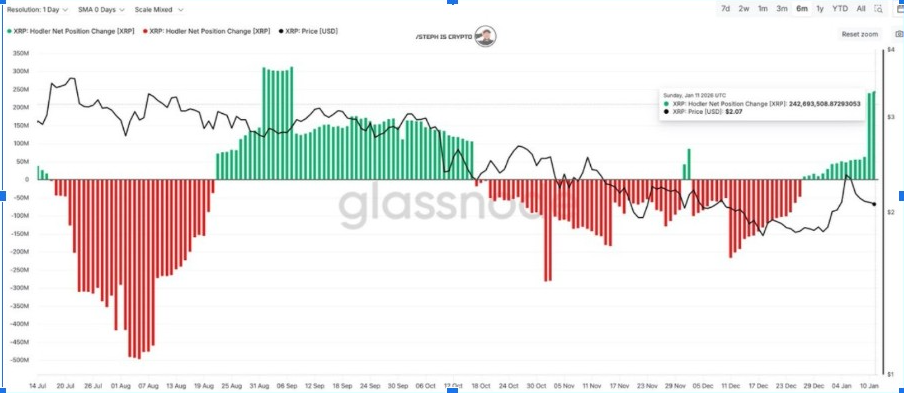
The move occurred while the XRP price remained range-bound, indicating positioning activity rather than a volatility-driven chase.
The chart separates distribution phases from accumulation phases, shown by green bars. During the latest upswing in net positioning, XRP price line remained steady, suggesting the added demand was absorbed within the existing range.
Ripple Inverse Head-and-Shoulders Structure Forms
On the 4-hour XRP/USDT chart, an inverse head-and-shoulders structure is visible, defined by a left shoulder, a deeper head, and a developing right shoulder. The right shoulder is forming at higher lows than the head, supporting the symmetry of the setup. The pattern spans the late-November to early-January portion of the chart, with the head marking the cycle low on that view.
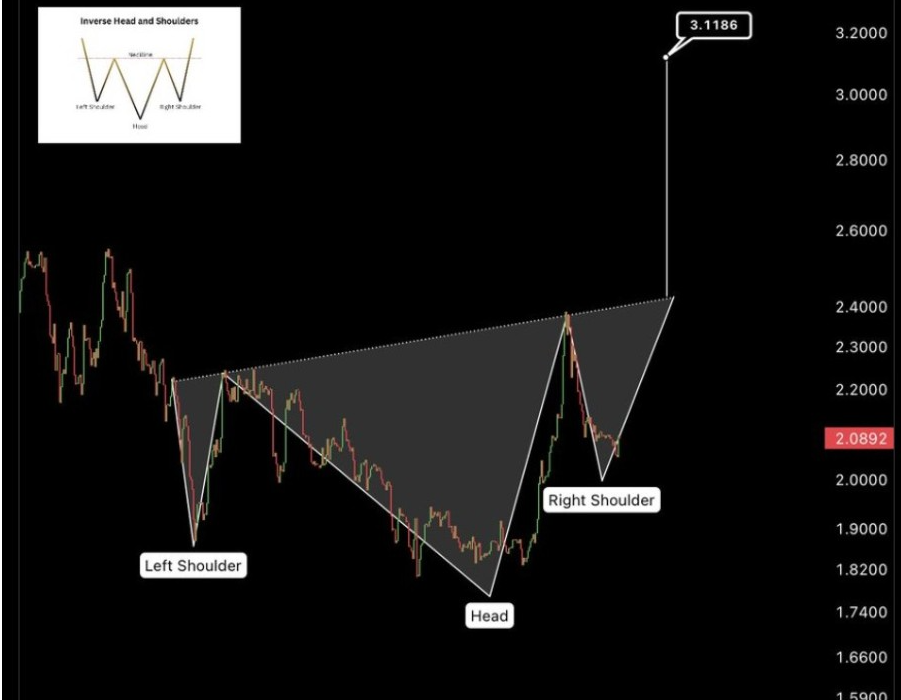
The neckline on the chart slopes upward, reflecting incremental demand improvement across swing attempts. Measured-move projections from the neckline to the head provide a technical reference zone, extending toward the low $3.00 area on the shared view.
The right-shoulder zone is located near the $2.00 area on the chart, keeping attention focused on the neckline region during any retest or breakout attempt.


