
 Puffer
 ZKsync
 Bitcoin
 NEAR Protocol
 Pearl
Pearl Quantus
 Sui
Sui

Dogecoin (DOGE) price is showing signs of life again. Although the meme coin’s price remains under pressure, the main indicators suggest a potential breakout. Analysts are referring to past gold cycles, traders’ positioning, and positive chart patterns.
DOGE Gets Attention as Gold Enters Stagnation Phase
In a recent post, market analyst Trader Tardigrade put forward an interesting macro comparison between the cycles of Dogecoin and gold. The chart indicate that Dogecoin’s price lies quietly during gold’s rallies but explodes once gold cools. This behavior was observed during the 2019-2021 cycle and appears to be recurring.
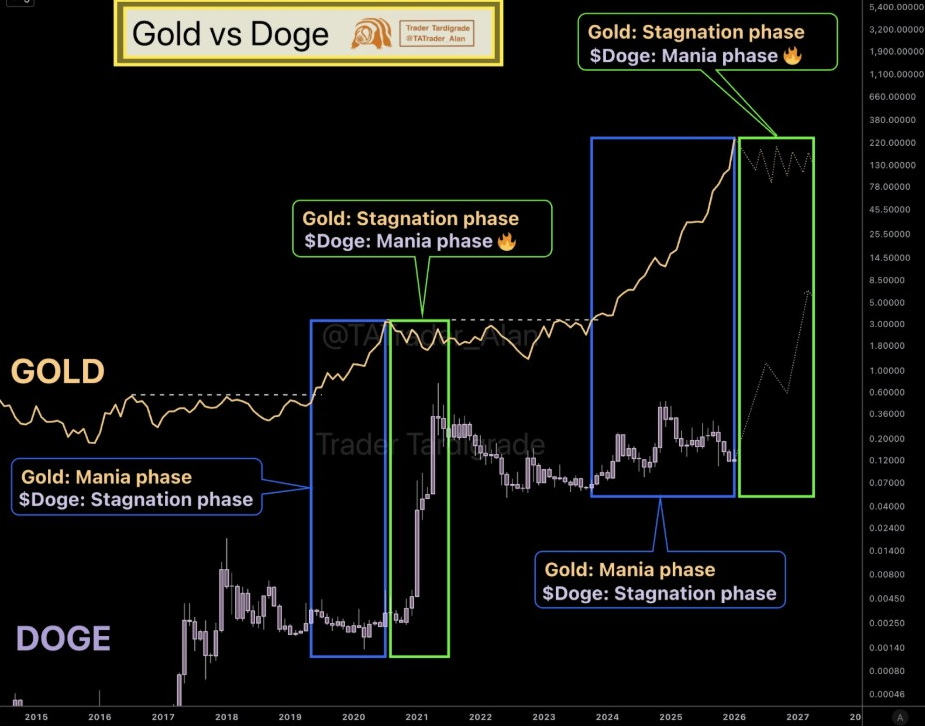
Gold has surged more than 60% in 2025, reaching an all-time high of over $5,100 in early 2026. Now, analysts say the precious metal is entering a phase of stagnation, just as Dogecoin begins to show upward pressure. Based on Tardigrade’s chart, this macro alignment may be a precursor to DOGE entering its “mania phase,” which historically is marked by strong vertical price action.
The implication is that DOGE could benefit from capital rotation. As gold slows down and risk appetite returns, speculative capital could flow into assets like Dogecoin. This pattern has held true in the past, and if it repeats, the current setup could provide a potentially explosive entry point.
Dogecoin Price Bullish Patterns Suggest Breakout
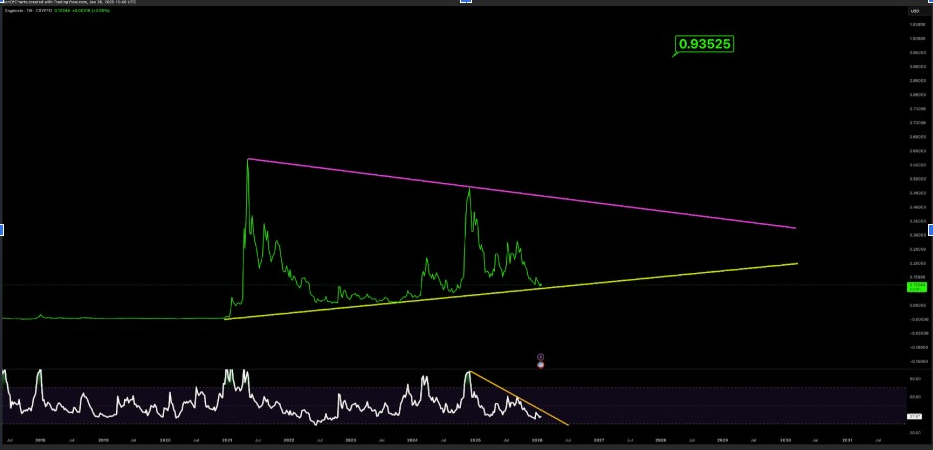
Technical analysis also favors a bullish case. Don showed a multi-year symmetrical triangle forming on the DOGE chart. Prices have been compressed near the apex, creating conditions for a high-volatility breakout.
The triangle is sitting on a long-term RSI bullish divergence. While DOGE has made lower lows in price, RSI has stabilized and even begun climbing, which is often an early sign of a trend reversal. Don’s target after a breakout is projected at $0.93525, a potential 7x move from current levels.
In another post, analyst FOUR pointed out a falling wedge pattern on DOGE’s weekly chart. This structure resembles that which was observed in Q4 2024 and preceded a strong rally above $0.40. The breakout projection from this wedge suggests a return to the $0.50 range if history repeats.
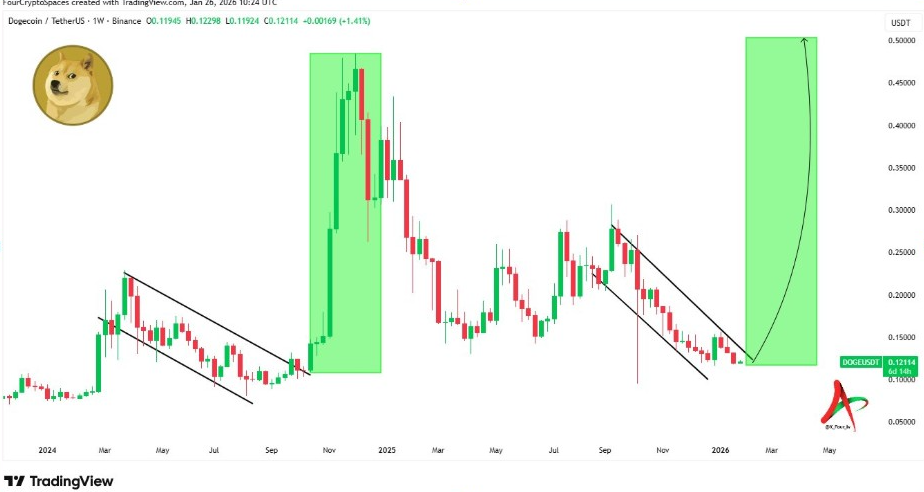
A breakout from this wedge indicates a return to the $0.50 range if history repeats itself.
Social Sentiment Weak Despite Elon’s Mentions
Interestingly, Dogecoin has yet to become popular, despite Elon Musk’s frequent Doge-themed tweets. Analyst LongTermR posted a chart showing how DOGE responded to Elon’s latest penguin meme post, gaining only 2.7% following the post, nowhere near the response that led to Dogecoin price spikes of 150% or more.
“Looks like I’ll be getting back to the trenches,” LongTermR joked, pointing to the current muted sentiment among retail investors.
This lack of retail FOMO may be significant. DOGE has a history of rallying hardest when sentiment is low, followed by sudden surges in attention. Right now, the charts are bullish, the traders are going long, the macro cycles are right, and the crowd has yet to catch up.
Top Traders Increase Long Exposure On Binance
Meanwhile, DOGE on-chain sentiment is improving rapidly. According to data shared by trader CW, the top traders at Binance are dramatically pumping long positions in DOGE. The long/short ratio for both accounts and positions has exploded since January 25.
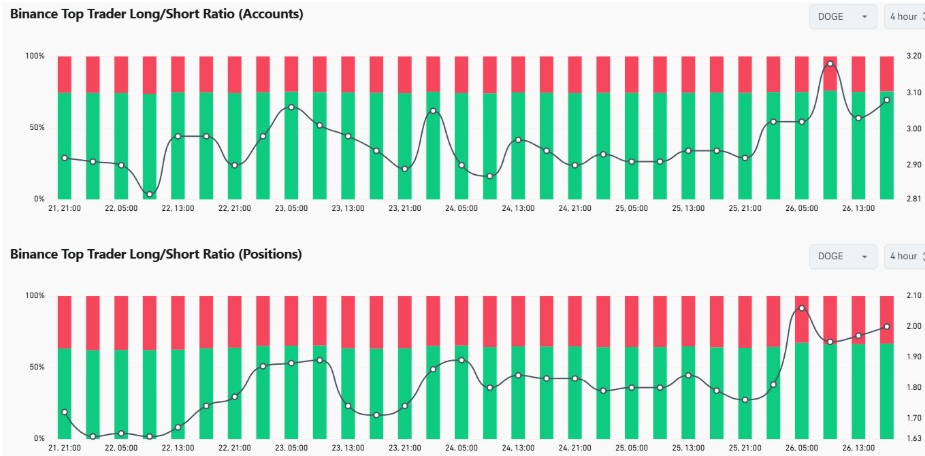
Specifically, the long/short ratio by accounts has soared past 3.1, indicating there are more than three long traders for every short trader. Similarly, the position-based ratio has also increased to 2.0, indicating that capital flows are now in favor of the upside.
This shift is notable because it reflects the conviction of high-volume, high-frequency traders. These market participants usually trade with tighter controls of risk and better insights. A rising long ratio is often a pre-indicator of price rallies in mid-cap coins such as DOGE.


