Pearl
Pearl Zylo Ecosystem
 Starknet
 Walrus
 Sui
Sui Bitway
 Pons
Pons

Bitcoin price continued its strong downward trend on Saturday, extending a decline that began in October last year, when it peaked at a record high of $126,300. This crash could persist even after several risky patterns form, as ETF outflows and geopolitical risks rise.
Bitcoin Price at Risk as Geopolitical Risks Rise
One key risk for Bitcoin price is that geopolitical risks have continued soaring. In a statement, Iran’s army chief warned that Iran warned that it would attack Israel as tensions with the United States escalated.
Geopolitical risks continued this week after Donald Trump warned of a great armada moving to the Middle East. He warned that he would attack the regime if it failed to reach a nuclear agreement with the United States. Trump has other demands, including Iran limiting its ballistic missile program.
However, most analysts believe that Trump’s goals are to change the regime as Israeli politicians have demanded. On the other hand, Iran has warned that any attack will attract retaliation, which may include blocking the Strait of Hormuz.
Polymarket odds of an attack have continued rising this week. Odds of an attack happening by December 31 have jumped to 81%. Similarly, odds of it happening by February 28 and March 31 have jumped to 59% and 64%, respectively.
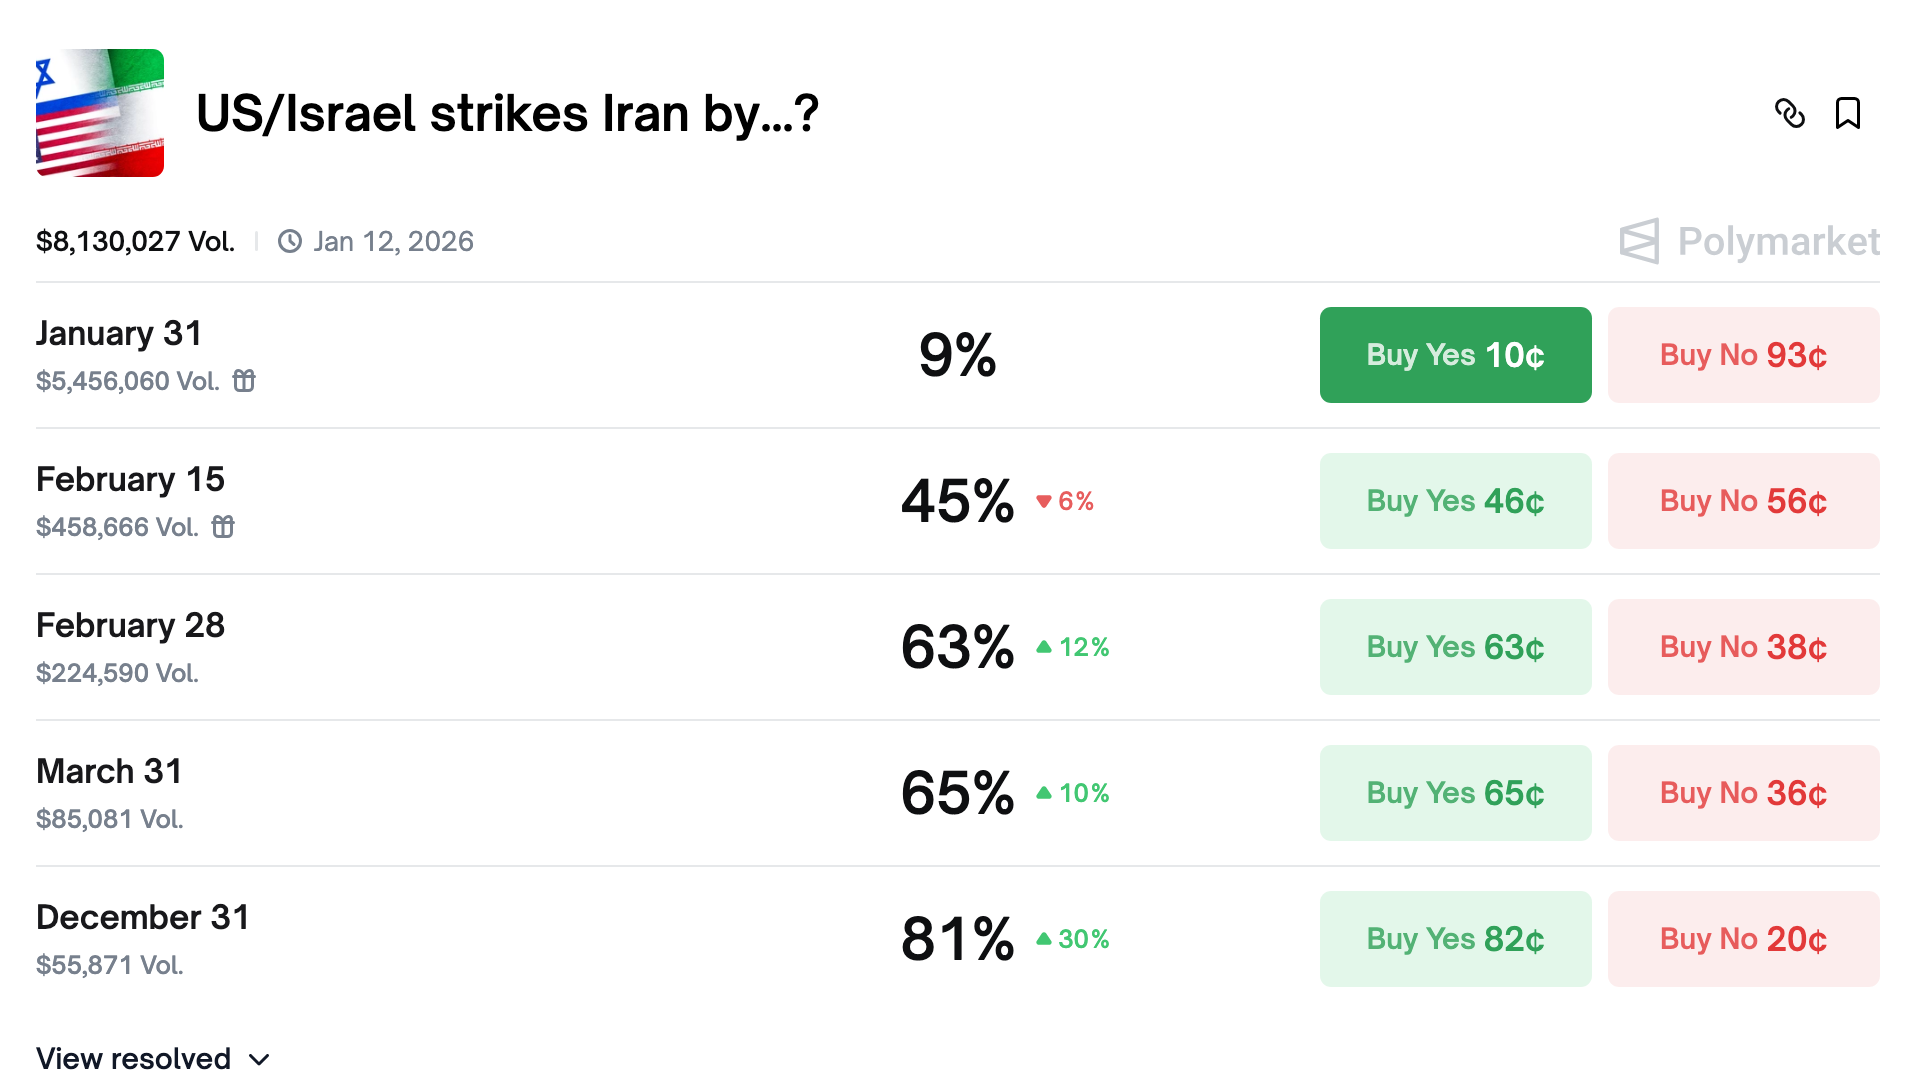
Polymarket Iran attack odds | Source: Polymarket
Bitcoin price is falling because the recent market action has proven that it is not a safe-haven asset as previously thought. For example, BTC crashed and liquidations soared on October 10 when Donald Trump warned of higher tariffs on goods from China.
It also retreated after Trump launched his reciprocal tariffs in April last year and only rebounded when he started negotiations. Most recently, Bitcoin price dropped when he threatened several European countries with tariffs for their support of Denmark and Greenland.
The ongoing retreat is also happening amid another US shutdown. However, unlike the one that happened last year, this one will be short as the Senate has already passed a spending bill. Chances are that the House of Representatives will follow through and vote to reopen the government
Bitcoin ETF Outflows Have Accelerated
Bitcoin price crash continued as ETF outflows accelerated. Data compiled by SoSoValue shows that spot Bitcoin ETFs shed over $509 million on Friday. They have had outflows in the last 4 consecutive days, bringing the weekly outflows to over $1.49 billion, up from the previous week’s $1.3 billion.
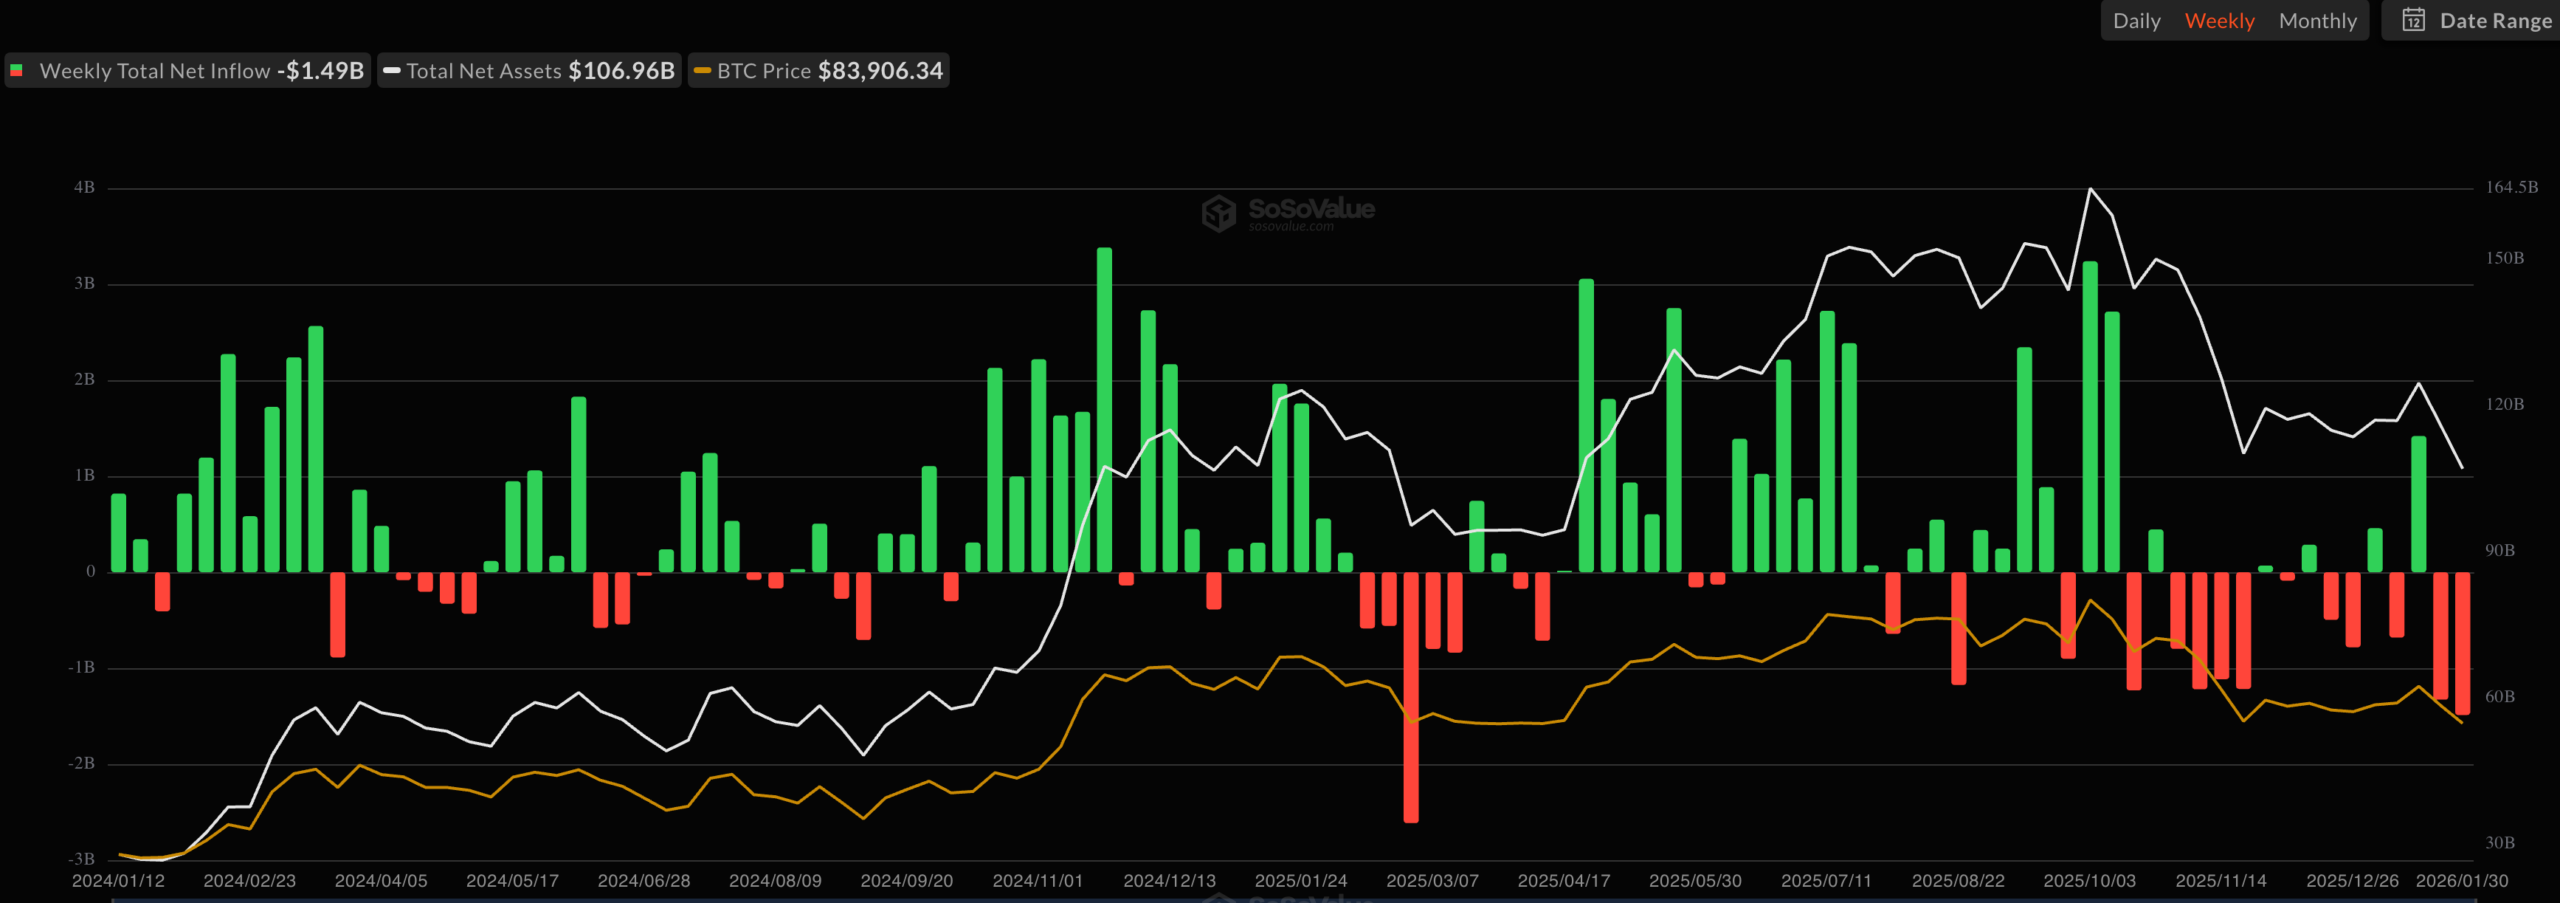
BTC ETF outflows | Chart: SoSoValue
Most notably, these funds have now had outflows in the last three consecutive months. They shed over $1.6 billion in January, $1.09 billion in December, and $3.49 billion in November.
Spot Bitcoin ETFs now have $55 billion in net inflows, down from a peak of $65 billion in 2025. BlackRock’s IBIT now holds Bitcoin worth $64.2 billion, down from a record high of nearly $100 billion.
Bitcoin Price Has Formed Risky Patterns
The weekly logarithmic timeframe chart shows that Bitcoin price has formed several bearish chart patterns that may lead to more downside in the near term.
First, the coin’s Supetrend indicator has turned red for the first time since January 22nd. Bitcoin dropped by 70% the last time that happened, and the same may repeat this year.
Second, Bitcoin has formed a bearish flag pattern and has already moved below the lower side. This pattern is made up of a vertical line and an ascending channel and is one of the most common bearish continuation signs in technical analysis.
Third, the coin has moved below the 50-week and 100-week Exponential Moving Averages (EMA), a sign that bears are now in control.
Before all this, the coin formed a giant rising wedge pattern, which is a common bearish reversal signs in technical analysis.

Therefore, the most likely scenario is that it continues to fall as bears target the next key support level at $80,000. A drop below that level will point to more downside to 70,000.