Aerodrome Finance
 Covenant x402
 Quack AI
 NEAR Protocol
 Pudgy Penguins
 Sui
 Pearl

- FTM has formed recent blocks of 14146137 with 1.1s rate.
- FTM top 10, 20 and 50, 100 holders have more than 70% holdings.
- RSI for FTM (for today) shows the SELL action.
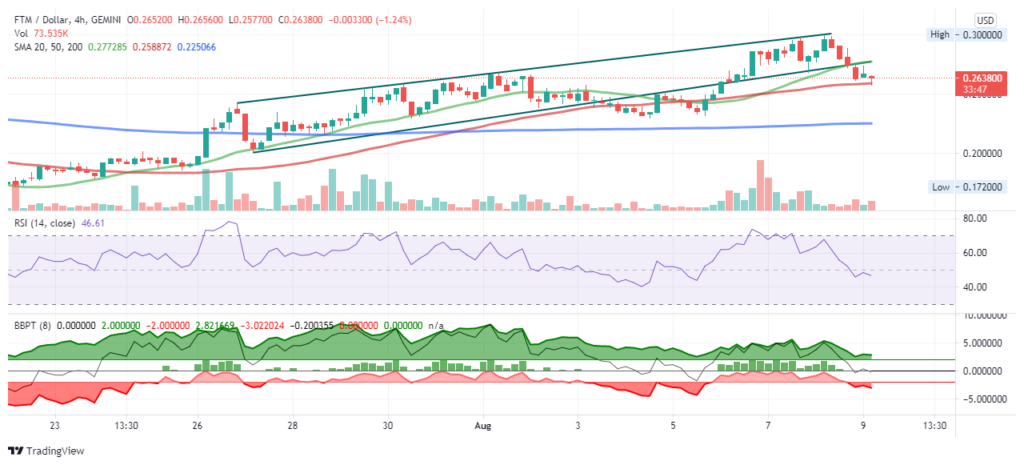
Fantom coin at present seems to be rejected by the external market means it is losing support from its holders and which is facing a mildly tough time like it was facing 4-5 August. It was back pushed after touching domes. Ironically, the same dome has been acting as a rigid breaker in its growth now.
However, crossing the past barriers at $0.1836 and $0.2154, FTM has crossed the path of the barrier and has shown the explosive upswing. Along with the other altcoins, FTM demand went moderately high. For now, the token has been showing the pattern of doji star bearish.
The token’s price slipped through the $0.2700 support level on 8 August and turned it into a resistance level. Since this point FTM has been sinking and marked the intraday low at 0.2571.
The token has entered into forming rallies since 24 July and have marked the July and till August high at $0.3000. Considering the recent fall, a retracement to 0.3000 to 0.2860 is marked within a day time frame.
FTM rose by 4.12% on Sunday. Following a 5.59% gain from Saturday, FTM ended the day at 0.2672. The last known price of this coin is 0.2635. A mixed start for the day saw FTM fall to an early morning intraday high of $0.2758 before hitting reverse.
DOGE seems to trail close to its first resistance level at $0.2643
It has the current trading volume(s) of 51,231,343 with a loss of 17.74% over the last 24 hours. FTM has addresses of 29,903 holders with the active transfer(s) of 488 in the last 24 hours.
The circulating supply of token is 2,545,006,273 FTM coins and a max. supply of 3,175,000,000 FTM coins. The total supply (The amount of coins that have been already created, minus any coins that have been burned. It is analogous to the outstanding shares in the stock market.) is 2,545,006,273
SMA-20, SMA-50 and SMA-200
The chart above shows the movement of FTM where 200 DMA has been running below SMA-20 and SMA-50. SMA-50 is running below to SMA-20.
It is SMA-20 which is above SMA-50 and SMA-200. We see the token with respect to SMA’s which are 20, 50 and 200. However, the candles formed now are sinking and are sustaining at SMA-50 mark.
We have seen the gradual returns here, marked under the trendline. The maximum returns formed 40% if bought at 0.1900.
The pattern formed on a 4 hours period chart is upwards and the trend line marked shows this upwards shifting.
BUY or SELL?
An RSI oscillator is also present in the chart which shows the proper time to buy or sell the token. RSI for the last 5 hours shows the value of 39.659 and marks the buy action.
All the MA’s show buy action except MA-5 which shows the sell action. MA-10, MA-20. Even MA-100 and MA-200 show the same buy action.
The bull/bear power has the value of -0.0183 and shows the sell action. The high/low marks the sell action with the value of -0.0049.
The FTM-BTC pair is trailing at the level of 0.000006154 and the loss of 8.36% was seen whereas the FTM-ETH pair is at 0.0000848 and the low of 5.37% was seen in the last 24 hours. The volume/market cap of the token is 0.0761 and its market dominance is 0.04%.
What does FIB suggest?
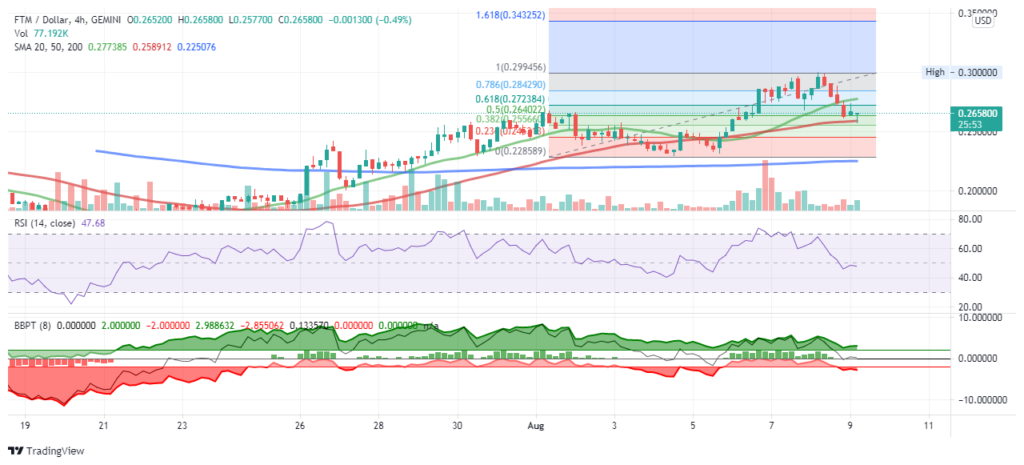
The candles forming now of coins are moving below the golden ratio and are making a fall in price. After 10 days the token has lost the support of FIB 0.618. Prevailed at FIB 0.5 FIB which later fell to FIB 0.382.
Well, the token is all set to sell by their holders and purchase by the interested investors.
Conclusion: We see the falling candles and according to the previous falls it has assumed that the candle would sink to 0.255 level and then we would expect a retracement.
The day’s range for the coin is 0.2573-0.2989. The FTM ATH is 0.9571 and ATL is 0.001935. FTM ROI (approximate return on investment if purchased at the time of launch) is 1727.69%.
FTM would need to move through a support level 1 to reach to the pivot point and then move through the pivot of 0.09003 to bring the first resistance level into play.
Technical Instruments:
Pivot: 0.262839
R-1 : 0.264306
R-2 : 0.265213
S-1 : 0.261372
S-2 : 0.260454
FIB 0.618: 0.275
FIB 0.5 : 0.263
FIB 0.382 : 0.256
Note:
- The unit is USD
- SMA-20: Green colour
- SMA-50: Red colour
- SMA-200: Blue colour