
 Puffer
 ZKsync
 Bitcoin
 NEAR Protocol
 Pearl
Pearl Quantus
 Sui
Sui

XRP is trading around $1.40, as analysts examine multiple chart formations that could signal a change in direction. Right now, the immediate attention is on the support level near $1.30 and the resistance at $1.55. Looking further out, potential breakout points are in the $2.70 to $3.00 range.
This has reignited interest in XRP price prediction, particularly because a falling channel pattern suggests a potential 100% gain, assuming it gets confirmed. In turn, the latest Ripple price action is being measured against both short-term breakout levels and longer-term structure.
XRP Price Prediction Tracks $3 Triangle Neckline
According to Hailey’s chart, XRP continues to form higher lows along a rising support trendline. At the same time, price is pressing against a horizontal neckline near $3.00. That structure creates an ascending triangle, which is often watched for compression before a directional break.
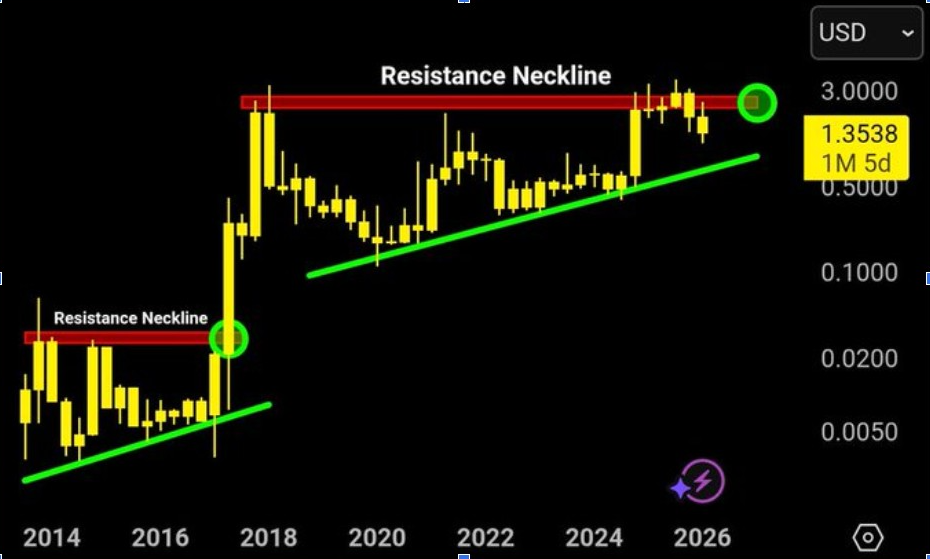
The chart places XRP around $1.35, well below the neckline, but still above long-term rising support. That keeps the broader structure intact for now. More importantly, the repeated tests of resistance suggest liquidity is building above the neckline, making that level central to the current XRP price prediction narrative.
Historically, similar XRP structures have preceded strong expansions once resistance was cleared. Hailey’s chart also marks earlier breakout confirmations with green circles. Those references have kept trader attention on the $3.00 level as a macro trigger, even while price remains far below it.
In the meantime, the key risk remains a loss of the ascending trendline. A break below support would weaken the bullish triangle structure and shift attention lower. Until then, the broader Ripple price pattern continues to reflect compression beneath a major resistance barrier.
Downtrend Cap Keeps XRP Price Below $1.55 Trigger
According to CRYPTOWZRD, XRP remains under pressure from a descending red trendline that has capped the price for weeks. The chart shows lower highs continuing to form, even as XRP attempts to stabilize above the $1.30 zone. That leaves $1.55 as the first important breakout point in the current XRP price prediction setup.
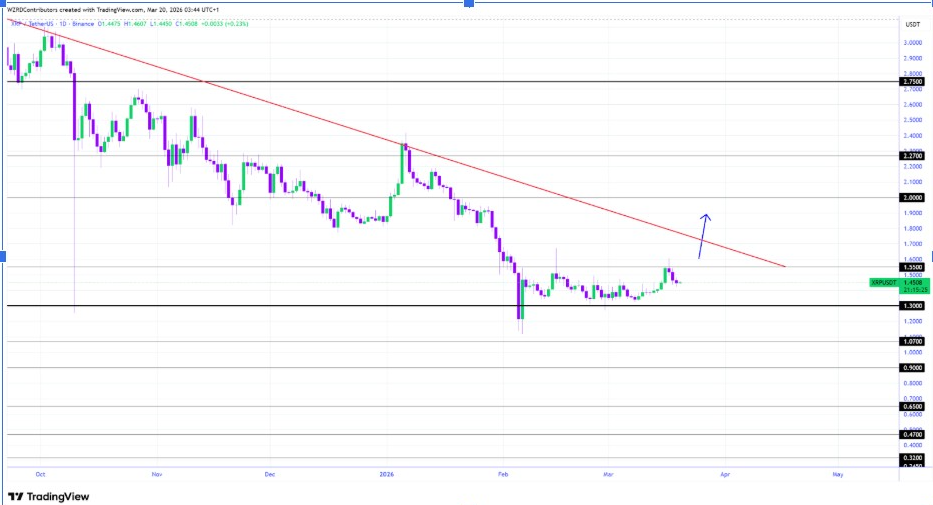
The analyst’s levels are clearly defined with current support at $1.30 and resistance at $1.55, $2.00, and $2.70. XRP has just bounced back from the $1.30 zone, suggesting a potential short-term base has formed. However, the descending trendline still acts as dynamic resistance directly above the price.
If XRP reclaims $1.55 and converts that level into support, the structure would begin to change. That could open room toward $1.90 first, followed by the $2.00 zone. In that case, the short-term XRP price prediction would shift from recovery to continuation.
On the other hand, a loss of $1.30 would invalidate the current base and expose lower levels near $1.07. That downside level remains relevant while resistance stays intact. Additionally, any breakout attempt would need volume support to confirm that buyers are regaining control of the Ripple price trend.
XRP Price Prediction Signals 100% Rally
Furthermore, analyst Ray’s chart adds support to the XRP price prediction by highlighting a falling channel. XRP has been trading within parallel downward channels, a common feature of corrective stages. The chart also reflects previous channel breakouts that gave 180% and 77% gains.
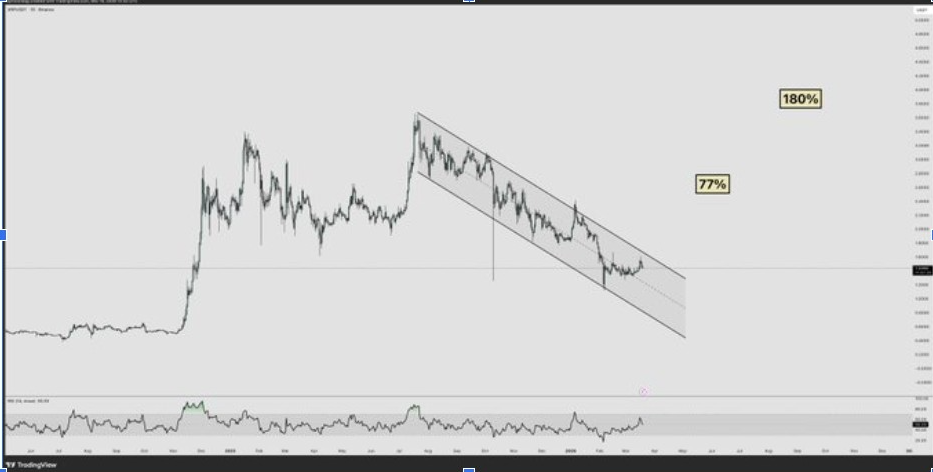
At present, XRP is testing the lower boundary of that channel while showing signs of stabilization. The RSI at the bottom of the chart is recovering from oversold territory. That signal often appears when downside momentum starts to weaken, and a reversal zone begins to form.
Moreover, compression at the channel floor suggests reduced selling pressure. An important bullish indicator in this structure will be a breakout above the upper limit. If that happens, the chart suggests a move of 70% to 100% could come into view, depending on follow-through.
If XRP fails to break the channel, the price could remain trapped in a sideways trade or continue lower within the pattern. For now, that makes the upper channel boundary the main level to watch. As a result, this chart has become central to the latest XRP price prediction discussions, with traders tracking whether current stabilization can develop into a confirmed breakout.


