Dacity Coin
 Bitcoin
 Pearl
Pearl NEAR Protocol
 Quantus
 Bittensor
 Pudgy Penguins

Gold and Bitcoin are again dividing investors as markets enter a cycle shaped by inflation, geopolitical stress, and weaker crypto sentiment. Gold price is holding above $4,500, while Bitcoin price has slipped below $70,000 and remains exposed to sharper short-term moves.
The latest debate now includes a historical chart comparing Bitcoin’s 2026 structure with gold’s 1970s bull cycle. The comparison has revived the question of whether Bitcoin can still follow a long-term breakout path, even as current market pressure keeps traders cautious.
Gold Maintains Strength While Bitcoin Faces Selling Pressure
Gold vs Bitcoin has become a sharper investment debate as markets enter the next cycle with high uncertainty. Both assets attract investors looking beyond cash and equities, but they move for different reasons. Gold still carries the longer safe-haven record, while Bitcoin remains a more volatile digital store-of-value asset.
At press time, gold traded near $4,529 per ounce, supported by lower Treasury yields and ongoing geopolitical tension. Bitcoin price traded around $69,674 after sliding toward a seven-week low. That move showed how quickly crypto reacts when risk appetite weakens.
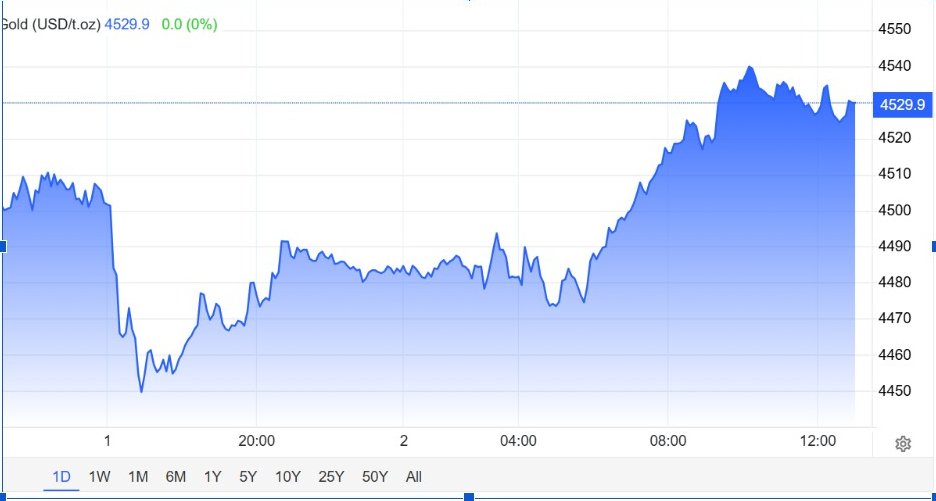
Gold moved higher after pulling back from Monday’s two-week high near $4,595. The metal stayed above $4,500 as traders weighed geopolitics, U.S. data, Federal Reserve expectations, and demand for defensive assets. Peace talks between the United States and Iran gave markets some relief.
However, fresh tension between Israel and Lebanon kept safe-haven demand active. The U.S. dollar also stabilized after recent weakness, limiting gold’s early recovery. Stronger U.S. factory data added another layer, with the ISM Manufacturing PMI rising to 54 in May from 52.7 in April.
Higher interest rates often weigh on gold, as the metal does not yield. Even so, gold remains less volatile than Bitcoin. Gold still holds its safe-haven appeal through deep liquidity, steady central bank buying, and a long record as a store of value. These factors keep it relevant when markets turn uncertain.
Bitcoin Stays Under $70K Pressure
Meanwhile, Bitcoin price moved below $70,000 as sellers returned across the crypto market. The total crypto market cap fell 2.44% over 24 hours to about $2.4 trillion, suggesting traders are reducing risk exposure across major digital assets.
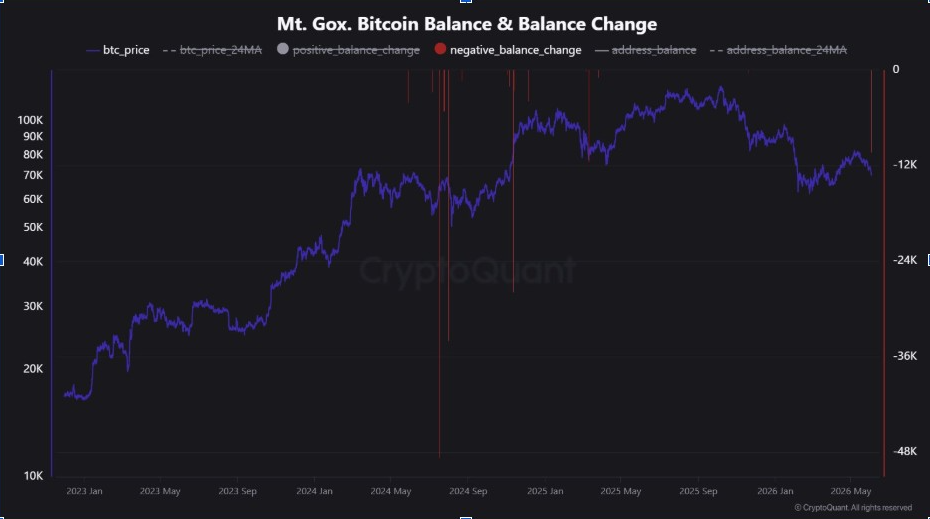
The decline followed a large Bitcoin transfer linked to Mt. Gox, which revived concerns about possible creditor selling. Traders are now watching $70,000 as an important short-term resistance zone. A failure to recover that level could expose Bitcoin to the $65,000–$66,000 range.
However, a $70,000 reclaim could support a rebound toward $72,000 or $73,000. That move would likely need stronger spot demand and a cooling in ETF outflows. For now, market confidence remains fragile as Bitcoin struggles to regain lost ground.
Spot Bitcoin ETFs also recorded weaker demand, with net outflows of $484 million on June 1. That marked the eleventh straight session of withdrawals. The streak added pressure to Bitcoin’s near-term outlook and showed that institutional demand has cooled.
This is where Bitcoin differs sharply from gold. Gold often benefits when uncertainty rises. Bitcoin can also attract long-term buyers during corrections, but it usually faces deeper drawdowns when liquidity tightens or leveraged traders exit.
Analysts Compare BTC Price With Gold’s 1970s Rally
Notably, a new Bitcoin-versus-gold cycle chart has added fresh attention to the debate. Analyst Predator66 shared a comparison between gold’s 1972 structure and Bitcoin’s current 2026 setup, suggesting that both charts show similar macro behavior.
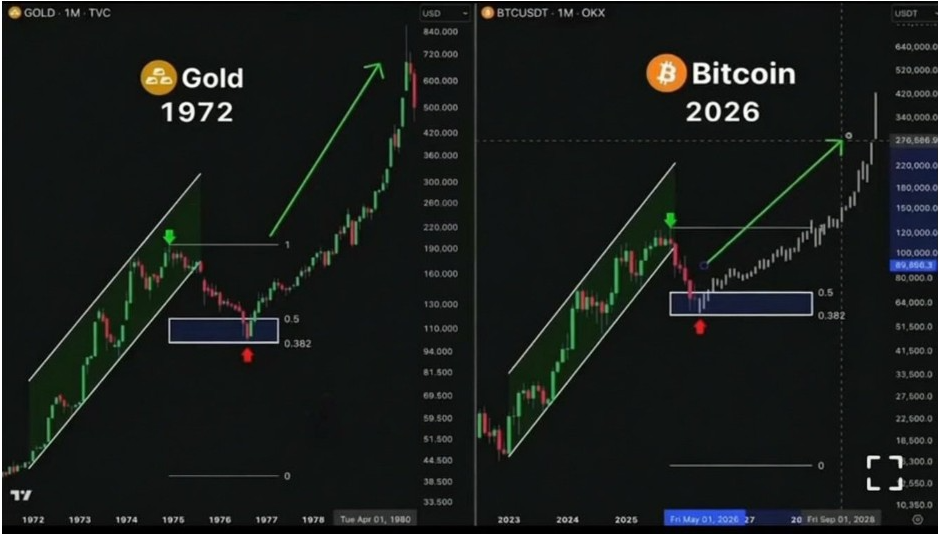
The gold chart showed the metal rising inside a channel, correcting into a major retracement zone, and then resuming a powerful long-term rally. The Bitcoin chart shows a similar pullback into a marked support area, followed by a projected continuation path toward much higher levels.
This comparison does not confirm that Bitcoin will repeat gold’s 1970s move. Still, it explains why some traders continue to view Bitcoin as a long-cycle asset despite current weakness. If Bitcoin follows a similar macro path, higher valuation scenarios may remain possible in future years.
Nevertheless, the two assets trade in very different environments. Gold’s 1970s move developed under a separate inflation and monetary backdrop. Bitcoin now trades through ETF flows, leverage, regulation, exchange liquidity, and broader crypto sentiment.