Zerebro
 Bitcoin
 Quantus
 Pearl
Pearl Starknet
 ZKsync
 NEAR Protocol

Bitcoin traded near the $60,000 level after a sharp selloff briefly pushed the market below $59,000. Analysts say the latest decline could mark the beginning of Bitcoin‘s historical bottoming phase as long-term cycle indicators return. EGRAG Crypto highlighted a bearish crossover between the 13-week and 33-week moving averages, arguing that the setup remains valid unless BTC closes above $74,000 on the two-week chart. Until then, traders continue monitoring lower support zones around $47,000, $43,000, and $37,000.
Crypto News: BTC Bottom Window Opens as $60K Support Faces Test
Bitcoin price dropped to an intraday low near $58,189 before a small rebound toward $60,000. The move came as selling pressure spread across the wider crypto market. Ether moved near $1,500, while several altcoins also posted deeper losses.
The decline followed weak demand in U.S. spot Bitcoin ETFs. SoSoValue data showed $696 million in net outflows on Thursday. The funds have now recorded six straight trading days of withdrawals.
Leveraged traders also faced heavy losses during the selloff. CoinGlass data showed more than $1 billion in crypto liquidations over 24 hours. Long positions made up about $842 million of that total.
Bitcoin led the liquidation wave with around $489 million in forced closures. Ether followed with about $295 million. The largest single liquidation on Hyperliquid reached $38.05 million.
BTC Crypto Moving Averages Put $74K in Focus
EGRAG Crypto said the Bitcoin price still follows a long-term cycle structure. His chart tracks past bearish crosses between the 13-week and 33-week moving averages. In earlier cycles, that signal appeared before deeper bottom ranges formed.
The analyst said the current setup remains active as long as Bitcoin stays below $74,000. A two-week close above that level could change the structure. Until then, the downside areas remain the main zones on his chart.
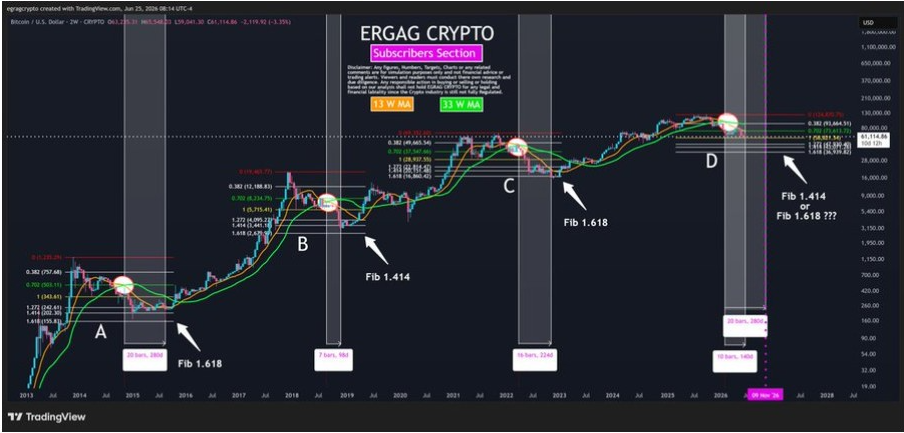
The chart places the first key downside level near $47,000. It then shows deeper Fibonacci areas near $43,000 and $37,000. These zones match the analyst’s view of possible cycle-bottom areas.
Other market watchers also flagged weak higher-timeframe signals. One trader said Bitcoin remains close to a weekly death cross. That setup did not mark the exact bottom in past cycles, but it did lead to long consolidations.
On-Chain Data Shows Weak Demand
CryptoQuant charts also show stress in Bitcoin demand. A four-year rolling realized price risk-reward ratio suggests Bitcoin has not yet reached a classic bottom zone. Past cycles often improved as the price moved closer to the realized price.
The realized price tracks the average cost basis of coins on-chain. Analysts use it to compare market price with investor cost levels. Every prior major cycle touched realized price before a stronger recovery began.
Another CryptoQuant chart shared by Ali Charts showed negative apparent demand for Bitcoin. The indicator stayed below zero through much of the recent period. It also improved from its June lows but remained negative.
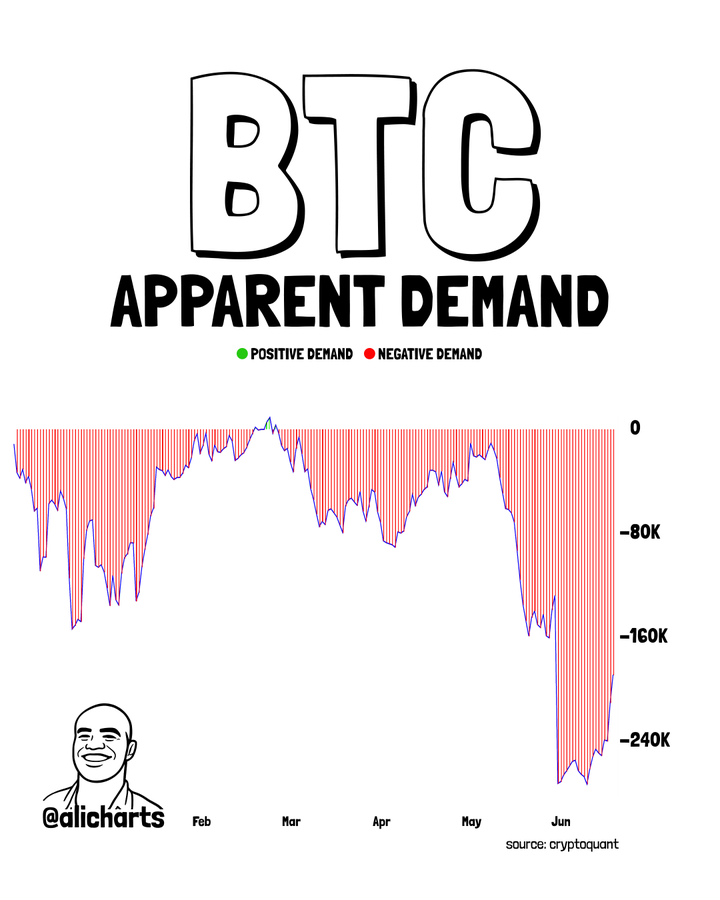
Short-term holders also showed pressure during the decline. CryptoQuant analyst Amr Taha said their market cap fell to $237.7 billion on June 26. That marked its lowest reading since October 2024.
Taha also said short-term holders sent about 50,000 BTC to exchanges at a loss. Binance received about 9,500 BTC from that group. These transfers do not prove direct sales, but they show rising stress among recent buyers.
Bitcoin Price Levels Traders Watch
Bitcoin now faces a near-term test around $59,000 to $60,000. Traders see that range as the first support area after the latest selloff. A stronger defense there could slow the decline.
The next upside area sits near $62,800 to $65,000. Bitcoin price needs to reclaim that zone to show better short-term strength. A move above it could shift attention toward the larger liquidity area near $67,000.
Momentum readings still indicate weak buyer control. The RSI remained near oversold levels, while the MACD stayed below the zero line. Those signals indicate that the rebound has not yet altered the broader trend.