hi
hi Boomer
 Lighter
 NEAR Protocol
 Covenant x402
 Pudgy Penguins
 Injective
- Vechain experienced an unwelcomed fall in its price by 11% during the intraday rally.
- Over $859,273,335 of VET was traded in the last 24 hours, a total increase of 34%.
- A sudden spike in seller’s volume resulted in the loss of market cap by 11.09%.
After a tough recovery, Vechain has again fallen and looks like it is trying to gain momentum again. The 23rd ranked cryptocurrency has suffered from some major ups and downs before and this time the sudden fall has created just another hurdle for the token having a market dominance of 0.33%. In the current scenario, the VET/BTC and VET/ETH pairs are underperforming with a decline of 5.3% and 6.8%, respectively. With the current decrease in its market cap, the volume/market cap comes out to be 0.1039.
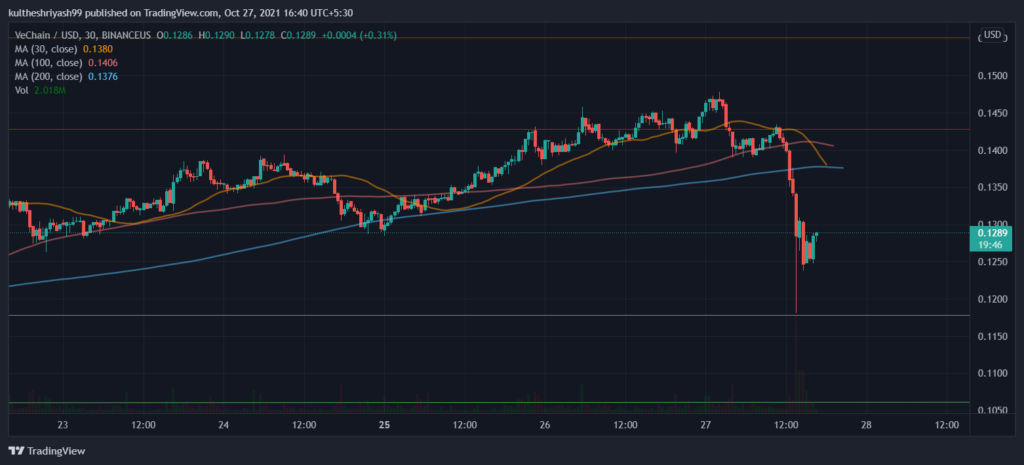
After considering the moving averages, one can observe the abnormality in the rally. That’s because for quite a while the token was trading above the major daily lines and suddenly the value is now under them. The 30-day MA curve has taken a downward turn, intersecting the 100-day line and about to cross paths with the 200 MA line as well. This might be an indicator of bearish momentum. In terms of a long-term plan, both 100 and 200 MAs gives out hope for a bullish trend as the lines are staying on their path with positive consistency.
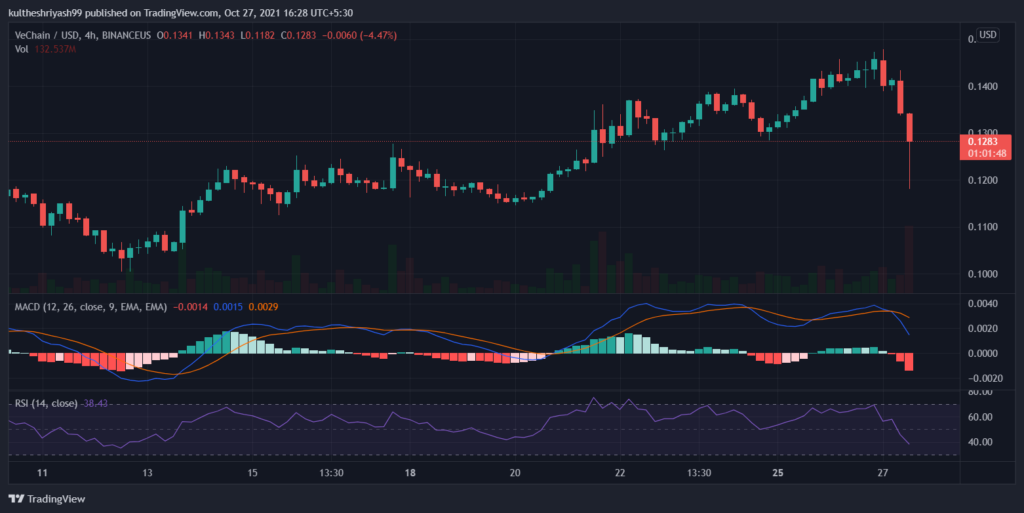
Another graph showing MACD and RSI values is set in a 4-hour time frame. The MACD, for now, continues to stay above the zero level with a tendency of diversion as the line currently traversing below the signal line. The histogram for most of the time stayed on top but now slightly going downwards as well. RSI has the value computed in the neutral zone after the token was trying to break the barrier of the overbought zone before. Vechain may experience resistance at $0.143 and $0.1552 and support at $0.106 and $0.1178.At the time of curating this article, VET has only touched the support level at $0.1178 and continues to shuffle.
Conclusion- Vechain may look in a not-so favourable condition to bet on but it has reminded us of his revisions of recovery. But this alone won’t be alone to blindly put trust in it as the dips can be uncertain and abnormal at times, especially during the short-term window. Investors are advised to first conduct research and then invest based on an updated parametric approach.
Resistance- $0.143 and $0.1152
Support- $0.106 and $0.1178