Identity.md 6900
 Bunker Mode
 Crawlerpad
 Claudia
 Quantus
 Starknet
 Bitcoin

Ethereum price has finally done what bulls waited months to see. After trading beneath a descending trendline for roughly six months, ETH crypto has broken above resistance and renewed expectations of a move toward $2,000.
The move does not guarantee a straight rally, but it changes the tone of the chart. Price now sits near a key decision area, where holding reclaimed support could decide whether this breakout becomes a real trend shift or another failed bounce.
Ethereum Price Breaks 6-Month Downtrend
Ethereum price has moved above the descending trendline that capped every major recovery attempt over the last six months. X-based market analyst Max Crypto, who regularly publishes technical market analysis for crypto traders, highlighted the breakout on the daily chart.
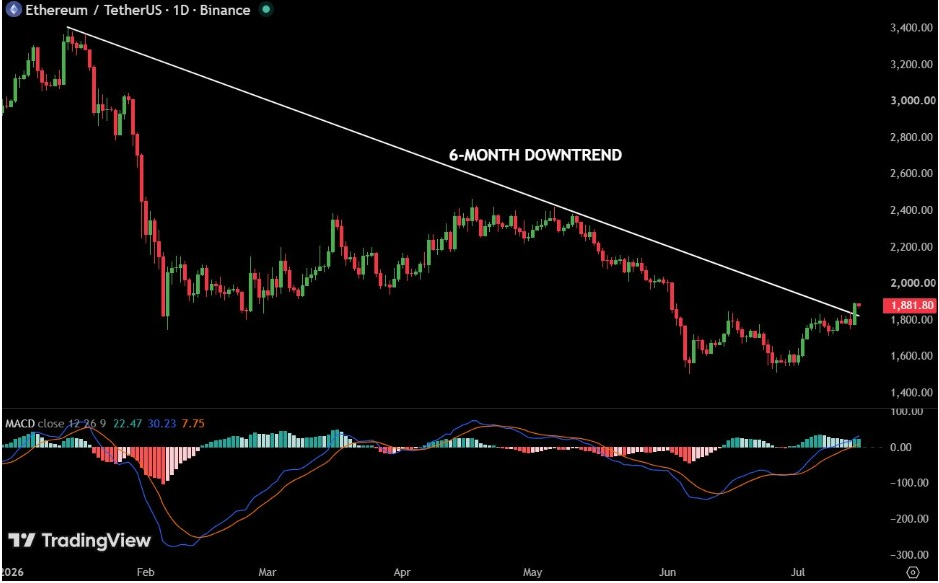
The chart showed ETH price recovering from the lower $1,500 region and pushing above the trendline near $1,850. The MACD also supports the shift, with the histogram staying positive and the signal lines curling higher after months of weak momentum.
This setup gives buyers their first clean technical win in weeks. However, ETH still needs follow-through above the breakout zone. A daily close above $1,850 keeps the structure constructive, while a drop back below that level would weaken the breakout and reopen the risk of another retest near $1,750.
ETH Crypto $2,100 Zone Comes Into View
Still, market analyst Daan Crypto Trades sees the market structure flipping bullish after ETH crypto reclaimed the $1,800 level. His chart marked the lower range near $1,500 as a base, followed by a sharp recovery and a “sign of strength” move above previous resistance.
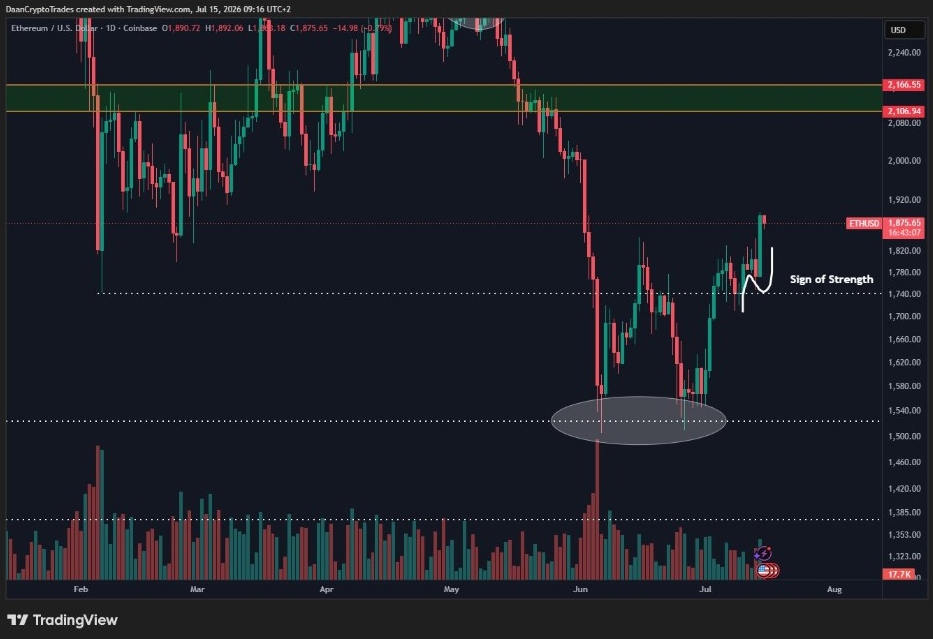
Daan pointed to the $2,100 region as the next higher-timeframe level. That zone has attracted heavy price action in previous months, making it a likely target if bulls keep building higher highs and higher lows.
ETH crypto must keep holding above $1,800 and avoid losing the reclaimed breakout area. If buyers defend that zone, the path toward $2,000 opens first, followed by the wider $2,100–$2,160 supply area.
Will ETH Crypto Break Out of $1,850 Support?
At the same time, crypto trader Ted Pillows said Ethereum price has fully reclaimed its key resistance level. His chart places the main breakout area around $1,850, with a possible push toward $2,000 if ETH holds above that level.
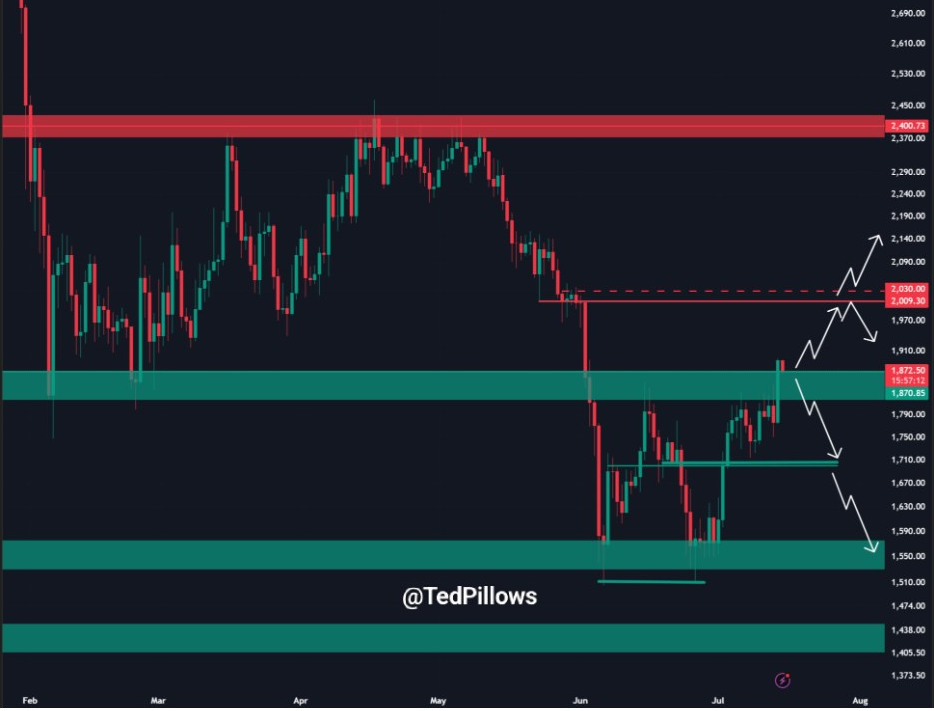
The setup showed ETH price clearing a red resistance band after bouncing from lower demand zones. The next path pointed toward $2,030 if buyers maintain momentum. From there, a stronger close could open a larger recovery toward $2,400, where ETH faced repeated rejection earlier this year.
The downside remains easy to track. A rejection from the current zone could drag ETH back toward $1,710. Losing that level would shift attention toward $1,550, where buyers previously defended the market.
This article is for informational purposes only and should not be considered financial or investment advice. Cryptocurrency markets remain highly volatile, and technical analysis or analyst projections do not guarantee future price performance. Readers should conduct their own research and assess their financial circumstances before making investment decisions.
Long-Term Roadmap Stays Bullish
Over a wider lens, analyst Crypto Patel’s chart presented Ethereum inside a larger multi-cycle structure tied to Bitcoin halving periods. The analysis marked ETH inside an accumulation zone after a deep correction, similar to past periods that later produced strong rallies.
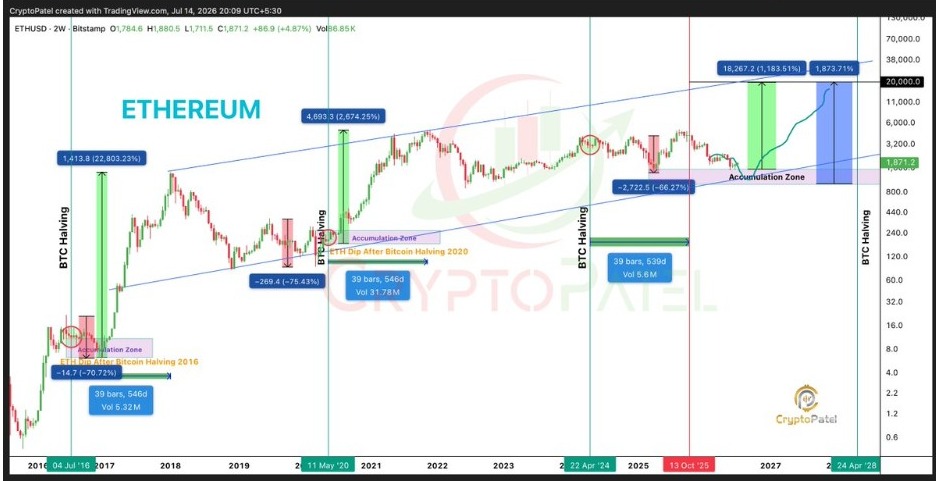
Patel’s roadmap shows ETH holding near the lower boundary of a long-term rising channel. Patel’s chart projects a possible long-term move toward $20,000 over a future market cycle if Ethereum remains within its historical accumulation structure. The projection reflects one analyst’s technical model rather than a forecast of future market performance.
Such long-term price targets remain highly speculative and depend on broader market conditions, institutional adoption, macroeconomic factors, and Ethereum’s continued network growth. They should not be interpreted as forecasts or guaranteed outcomes.
Ethereum traded near $1,880 at publication, recovering from its June low near $1,550. For the near term, the next test sits at $2,000, while $1,850 now acts as the level bulls cannot afford to lose.