Doge Pepe
 Bitway
 Pons
Pons Sui
Sui Pearl
Pearl Ronin
Ronin Zcash
Zcash

Ethereum price is back at one of those levels where the chart starts to matter more than the noise. The token has slipped from its recent high, but buyers are still defending the broader $1,670–$1,750 zone. That zone now carries extra weight.
Meanwhile, ETF demand has returned, short sellers appear to be closing positions, and several analysts are watching whether ETH can turn this area into a base before attempting another move toward $1,850 and $2,400.
Ethereum Price Holds Macro Accumulation Zone
Ethereum price is trading around $1,720–$1,750 after a sharp rejection from higher levels. The token remains above the $1,670 support area, although it has not yet confirmed a stronger bullish reversal.
GeoMetric said Ethereum price has flashed its first accumulation signal since last year’s liquidation lows. His weekly chart places ETH inside a broad macro value area, where previous market cycles have formed long accumulation ranges before stronger moves.
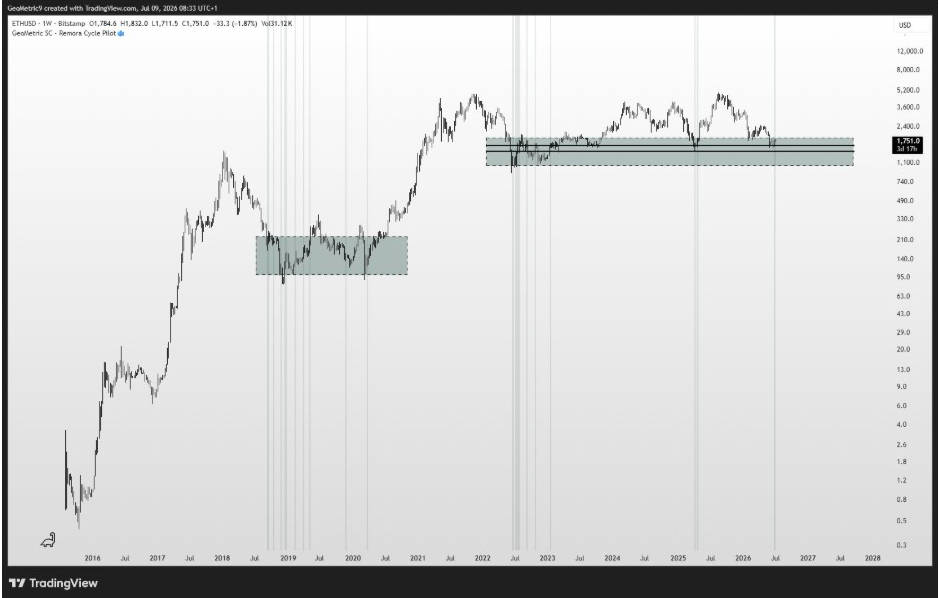
The analyst said revisits into earlier accumulation zones do not always need a fresh signal. However, the latest beam adds confidence that ETH crypto is again trading in a region where long-term buyers may become more active.
The chart also showed ETH sitting near a wide support band that stretches roughly from the low $1,000s into the current price area. That keeps the broader accumulation case alive as long as Ethereum avoids a clean breakdown below the zone.
ETH Crypto MA50 Rejection Keeps $1,850 in Focus
Meanwhile, Ash Crypto noted that Ethereum price has dropped around 6% from its recent high after rejection from resistance and the daily MA50. His chart shows the 50-day moving average near $1,788, with ETH now trading below it.
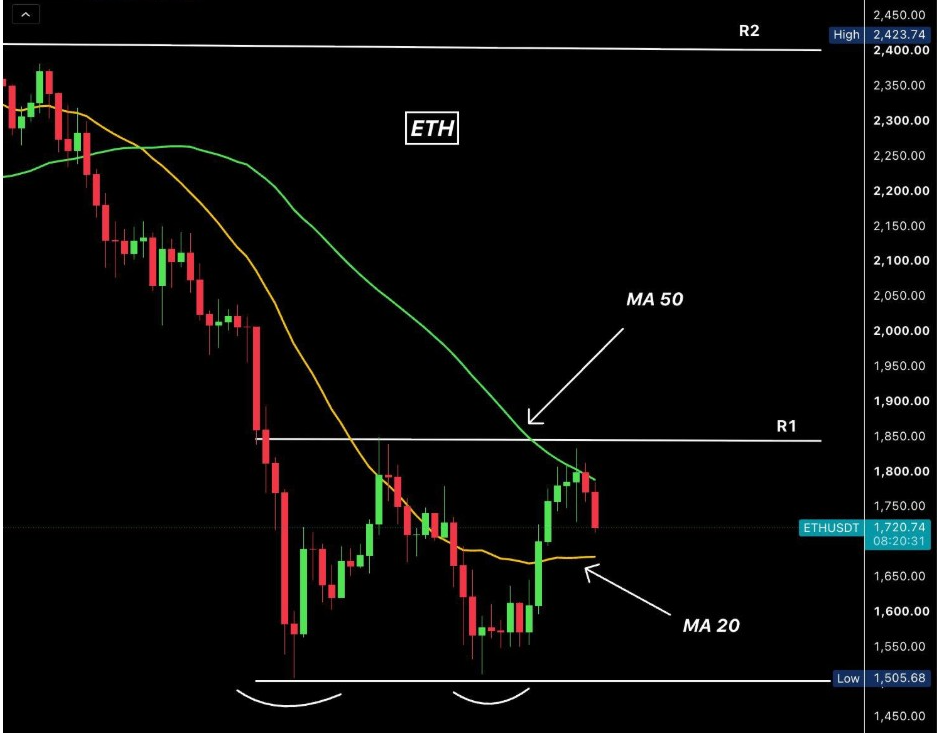
That rejection makes $1,850 the first major breakout level. A daily close above that area would place Ethereum back above short-term resistance and could give bulls a cleaner path toward higher levels.
The same chart marks $1,670 as immediate support and $1,500 as stronger downside support. ETH recently bounced from around $1,505, making that level important if sellers regain control. Holding above $1,670 keeps ETH crypto inside a constructive recovery range. Losing it may invite another sweep toward $1,500 before buyers step in again.
On the upside, $1,850 is the level bulls need to reclaim first. Above that, the next major resistance zone sits near $2,400, which also aligns with another analyst’s long-term resistance map.
ETF Inflows Give Bulls a Timely Boost
Notably, Ted said spot Ethereum ETFs bought $70.48 million worth of ETH in the latest session. The data marks the largest daily inflow in four weeks, according to the chart he shared.
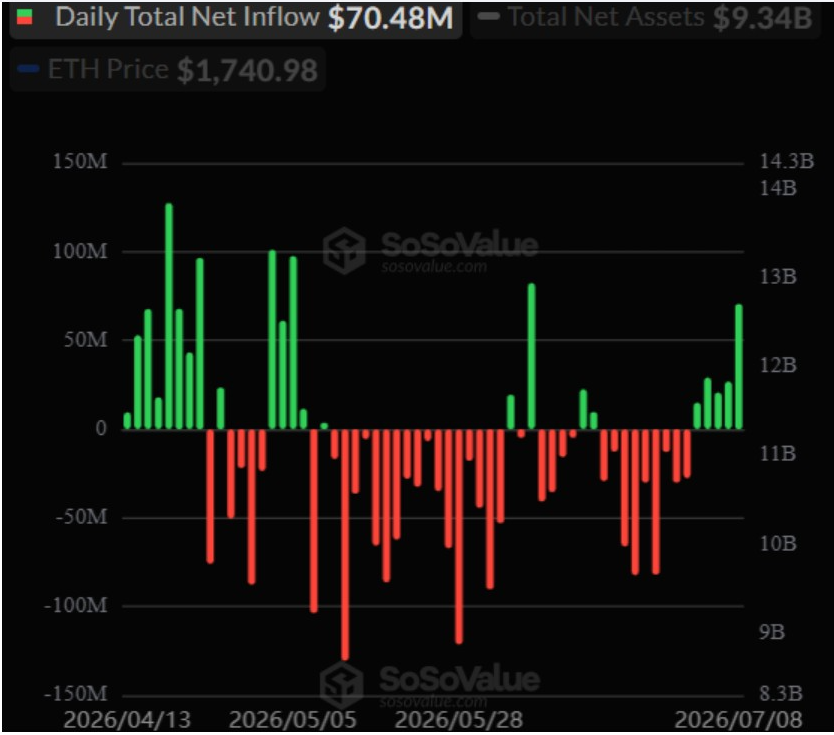
That shift matters because Ethereum ETFs had recently faced persistent outflows. A strong inflow day suggests institutional demand is returning, with ETH still trading near support.
The SoSoValue chart also shows total net assets around $9.34 billion, with ETH priced near $1,740. The inflow does not erase the recent weakness, but it gives bulls a fresh demand signal after weeks of pressure. ETF inflows can help stabilize prices when spot buyers absorb supply.
Short Covering Meets $2,400 Resistance
At the same time, CW900 said Ethereum open interest is falling while net position delta is rising. In his view, that shows short closing is still underway rather than a full leverage-driven rally.
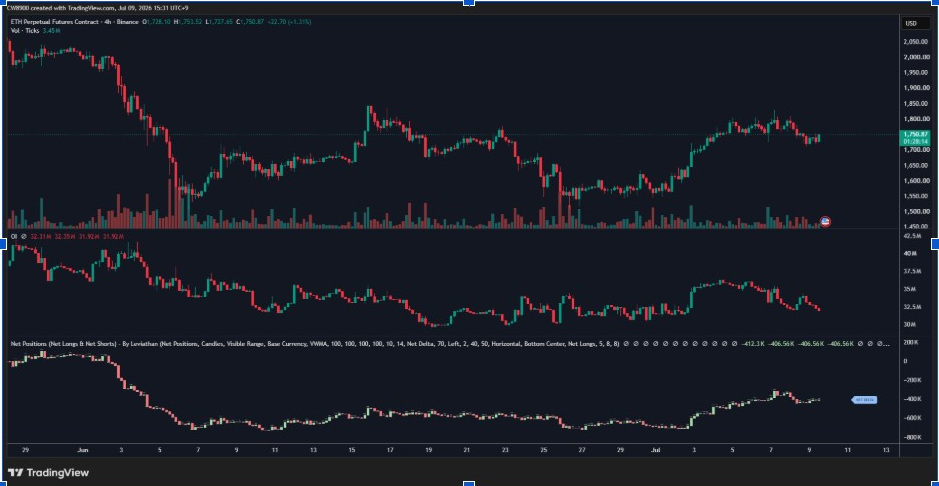
That distinction is important. Short covering can lift Ethereum price quickly, but a stronger rally usually needs both open interest and net position delta to rise together. Until that happens, the move may remain corrective.
Osemka also pointed to the bigger resistance map. His chart shows Ethereum near long-term VWAP levels tied to the 2018 top and bottom, while the largest resistance sits around $2,400.