Wisp
Wisp Identity.md 6900
 Bunker Mode
 Crawlerpad
 Claudia
 NEAR Protocol
 Pudgy Penguins

Bitcoin traded near $78,200 on Aug. 30 after failing to hold above $81,000. The Bitcoin price USD setup weakened as traders watched lower liquidity and renewed whale accumulation.
The pullback mattered because Bitcoin had already tested a major resistance band. Traders now faced conflicting signals from price structure, large-holder buying, and nearby liquidation zones.
Bitcoin Price USD Stalls Below $81,000 Resistance
CoinMarketCap data showed Bitcoin near $78,200 on Aug. 30. The asset remained roughly flat over 24 hours after trading above $80,000 earlier.
TradingView’s Bitstamp BTC/USD chart showed a sharp intraday recovery toward $78,700. Price then stalled below the recent local high, leaving the $81,000 area unchallenged.
The chart also showed Bitcoin holding above an intraday volatility reference near $78,500. However, the broader structure remained capped below the previous rejection zone.
CoinMarketCap showed Bitcoin still up roughly 21% over 30 days. That monthly advance contrasted with weaker momentum near the latest resistance area.
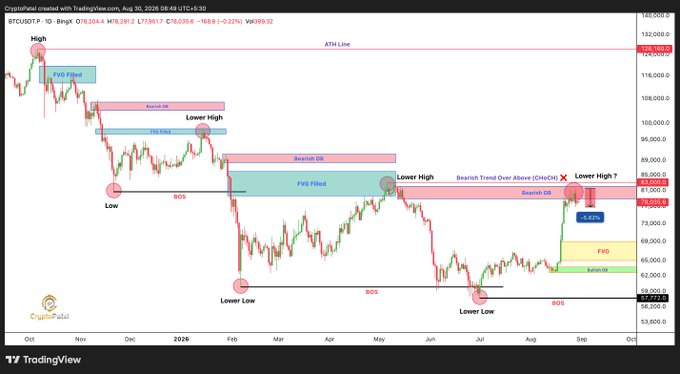
Crypto Patel wrote that Bitcoin had rejected the $81,000–$83,000 higher-time-frame resistance area. He identified $83,000 as the level that would invalidate his bearish setup.
That rejection kept the price of bitcoin below a zone where buyers previously failed. A sustained close above that area would alter the immediate structure.
Until that confirmation arrives, the rejection leaves short-term buyers defending a narrower range beneath established supply.
Bitcoin Price USD Faces $74,000 Liquidity Risk
Crypto King wrote that BTC crypto remained between two liquidation areas. He placed upside liquidity between $80,000 and $83,000.
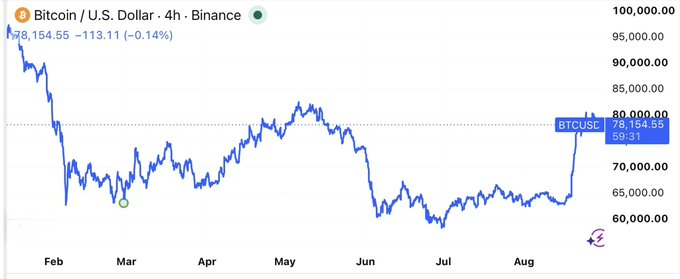
The analyst placed downside liquidity between $74,000 and $77,000. He said the recent rally had already cleared part of the upside liquidity.
That left lower liquidity exposed if buyers failed to recover the range high.
Ted Pillows also expected another pullback before a renewed breakout attempt. He wrote that Bitcoin could test $74,000 before moving above $81,000 again.
CrypNuevo described Bitcoin as stuck near range highs and strong resistance. He said consolidation, retracement, or a breakout could determine the next move.
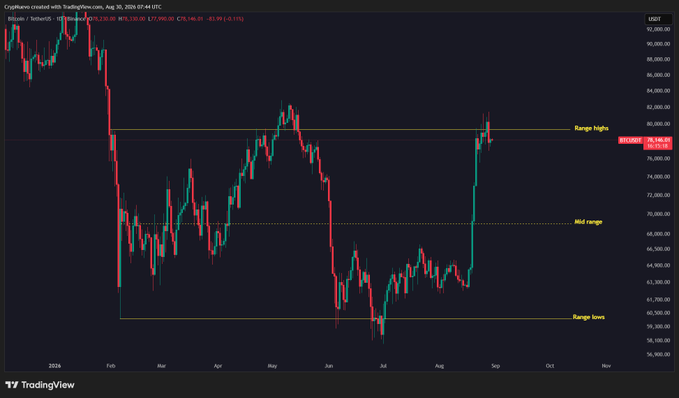
Those views aligned around one immediate issue. Bitcoin remained below resistance while nearby downside levels offered a clearer liquidity target.
CoinGlass describes liquidation heatmaps as tools tracking areas where leveraged positions could face forced closure. Such zones attract attention when price approaches concentrated leverage.
Forced closures can amplify movement after price enters a heavily positioned area. They do not establish direction before the trigger occurs.
The data provider also tracks Bitcoin futures open interest across major exchanges. Rising leverage around narrow ranges can increase sensitivity to abrupt price moves.
Whale Buying Counters Short-Term Weakness
Ali Martinez wrote that whales accumulated more than 39,154 BTC during the previous week. At prices near $78,000, that position carried a value above $3 billion.
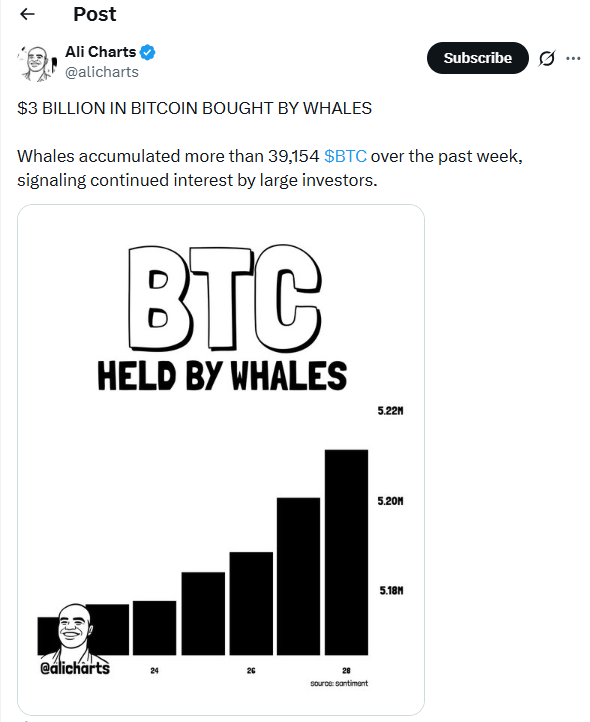
The accumulation contrasted with the short-term rejection near resistance. Large-holder buying can support spot demand, but it does not guarantee immediate upside continuation.
TradingView also reported that larger Bitcoin wallets accumulated during the recent advance. Smaller wallets reduced exposure during the same period, creating a holder-level divergence.
That divergence helped explain why BTC crypto held near $78,000 despite repeated resistance. Buyers absorbed supply, but they had not forced acceptance above the upper range.
Bitcoin’s protocol also limits total issuance to 21 million coins. Bitcoin.org documentation identifies that fixed supply schedule as a core monetary feature.
The supply cap does not determine short-term direction. Spot demand, derivatives positioning, and profit-taking still shape short-term market behavior.
However, whale accumulation affects available market supply when large holders remove coins from active circulation.
Bitcoin Watches $74,000 Support Next
The next verifiable levels sit on both sides of the current range. Traders were watching $74,000–$77,000 below and $80,000–$83,000 above.
A move through either area would test the competing analyst views. The lower band sits closer to current trading levels.
That makes downside liquidity relevant before any renewed test of $81,000 during the next trading sessions. Until then, the price of bitcoin remained trapped between resistance and concentrated liquidity.
Crypto Patel kept a deeper $55,000–$50,000 downside objective if the higher-time-frame rejection persisted. That target remains an analyst scenario rather than a confirmed market outcome.
For the near term, $83,000 remains the clearest invalidation level for the bearish setup. A loss of $74,000 would instead extend the correction and expose lower support.