Minter
 Quack AI
 NEAR Protocol
 Sui
Sui Hyperliquid
 Cardano
 Raydium
- Bitcoin Cash Coin 2022 Price Prediction, after trading sideways near the central support zone, bulls can consider it a strong demand zone for the upcoming year 2022.
- BCH is trading below its all vital moving averages of 20, 50, 100, and 200, while bulls are trying to suppress its short-term moving average line of 20-day.
- The pair of BTC/BTC is trading at 0.008878 BTC with an intraday drop of -0.86%, and the ratio of BTC/ETH is CMP at 0.1111 ETH with a 24-hour change +0.11%.
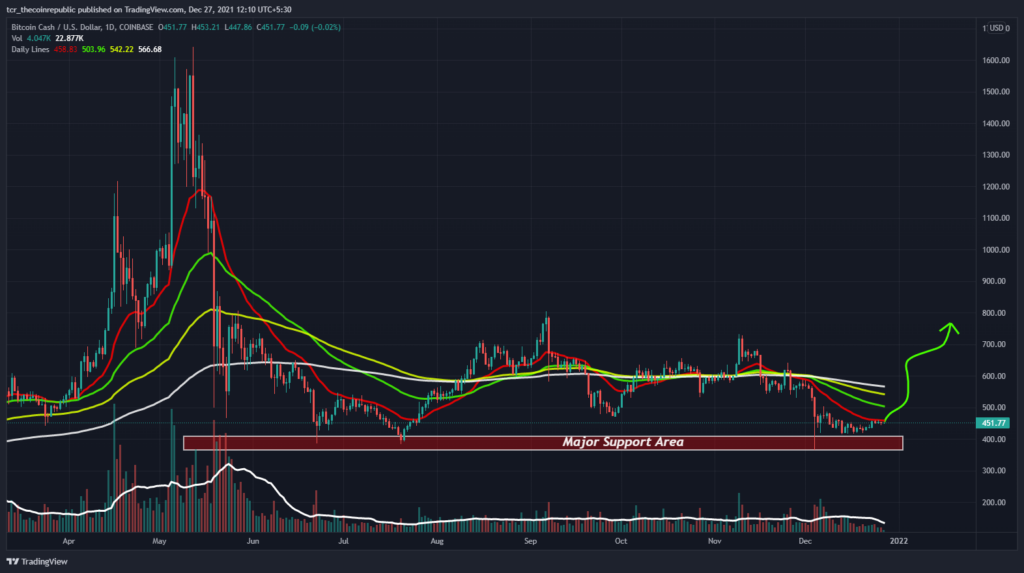
Bitcoin Cash Coin 2022 Price Prediction seems to be getting ready for the next bull run for the upcoming trading sessions. The crypto asset is currently placed near the primary support zone, and now bulls may take charge for an upside move. Volume activity has been average for the past few months and needs to grow strongly for the next lap of a bullish move. BCH is currently trading below all vital moving averages of 20, 50, 100, and 200-day lines, and buyers struggle to suppress the 20-DMA line. Volume activity will first give bulls a sign of strength once the crypto asset manages to regain 20 and 50-DMA line. Support on the lower side is $400 and $360, whereas resistance on the higher side is $540 and $620.
Bitcoin Cash Coin 2022 Price Prediction is heading higher at the 4-hour time frame
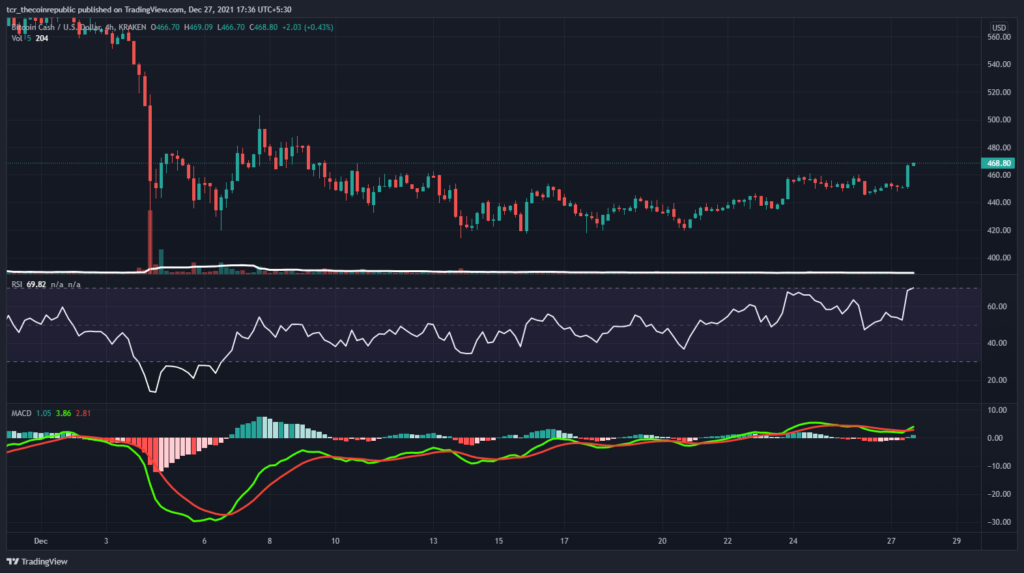
Bitcoin Cash Coin 2022 Price Prediction is heading higher at the 4-hour time frame. BCH at the weekly chart is consolidating under the narrow range and now it seems bulls are taking charge. Meanwhile, the technical parameters are heading higher after a strong buying interest from lower levels. The digital asset witnesses decisive buying action from the lower levels and now testing the overbought zone. BCH is trading at $467 with an intraday gain of +3.56%, and the volume to market cap ratio is 0.6151.
Relative Strength Index (OVERBOUGHT): Bitcoin cash coin RSI is at 68, heading higher after recovery from lower levels. The coin is trading near the overbought zone and can project a strong recovery with strong buying action.
Moving Average Convergence Divergence (BULLISH): The daily chart projects a bullish trend at the 4-hour time frame. The buyer’s signal line (green) is trying to suppress the seller’s line (red) with a positive crossover.
Support levels: $540 and $620.
Resistance levels: $400 and $360.
DISCLAIMER
The views and opinions stated by the author, or any people named in this article, are for informational ideas only, and they do not establish the financial, investment, or other advice. Investing in or trading crypto assets comes with a risk of financial loss.