
 streamoors
 IGNITION
 Sui
Sui Quantus
 Bitcoin
 Pearl
Pearl Solana
- The Graph token is following downward momentum into the descending wedge pattern in the daily time frame.
- GRT Token is in the bullish territory after retesting the falling wedge pattern’s lower verge.
- GRT price with the BTC pair is looking bullish by 3.20% at 0.00001123 BTC.
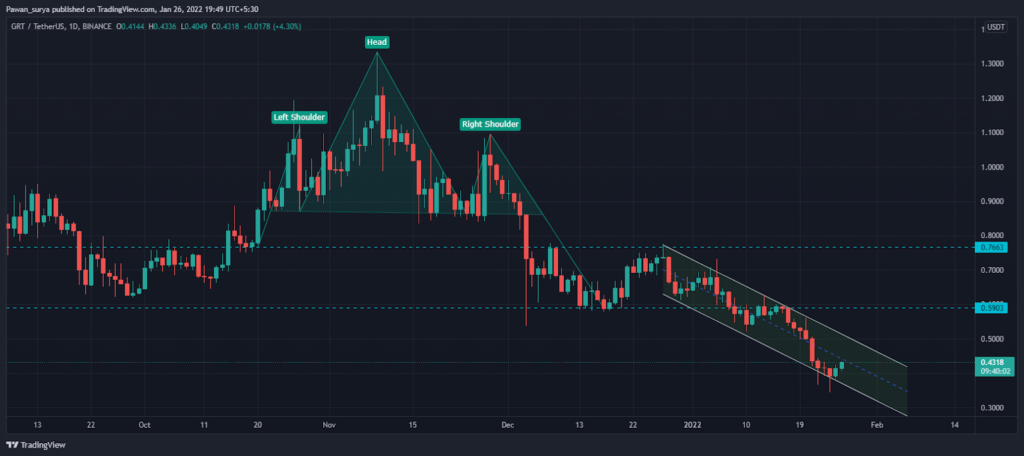
For a long time, the bulls have dominated the Graph token, which is battling in a bearish falling pattern. Investors booked their profits and continued to sell GRT when it reached an all-time high of $2.88 in mid-February.
Today, The Graph Token notices bullish territory by 4.17% at $0.4288. Over the past 24-hours, trading volume declined by 10.9% at $88 million. GRT price with Bitcoin pair is slightly positive by 3.20% at 0.00001123 BTC as well as ETH pair with asset price appears neutral by 0.78% at 0.000164 ETH. However, GRT has 0.12% market dominance in the entire cryptocurrency industry, and Volume to Market Capitalization ratio is 0.04349.
Since Mid -October, the price action of GRT drew head and shoulder pattern in the daily time period, and as soon as token broke the neckline of this formation asset formed support on $0.59, a bit of consolidation token again came into a downtrend by making lower-low formation (considered as a descending wedge pattern). Recently the token retested the lower verge of this pattern and rebounded.
GRT Bounced Back After Retested Lower Verge of Descending Wedge Pattern
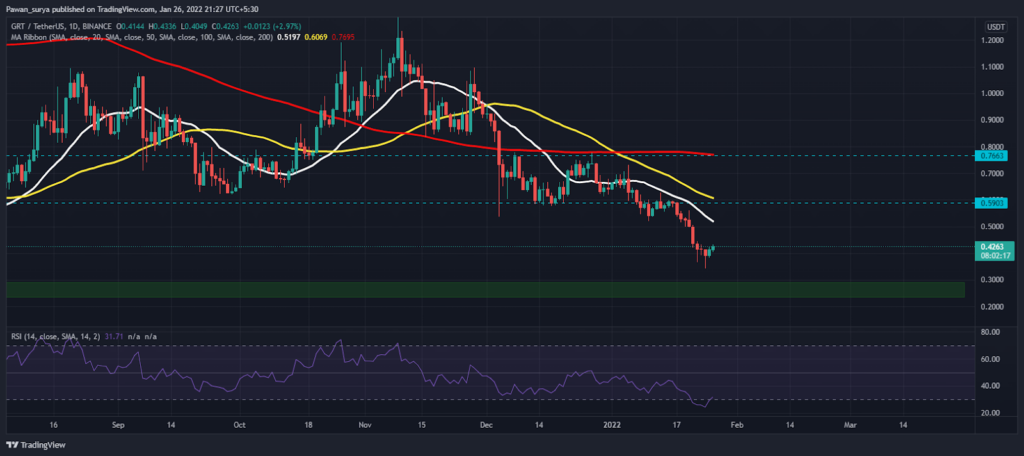
At the time of writing, GRT token price trading is below the major moving averages (including 20,50,100,200 MAs). 50 MA stood to be the level of volatility for a long; Hence, bear dumbed asset price below 50 MA last time, token became in the bearish territory.
RSI is still bearish because whenever investors attempt to jump the price of GRT, bears get an excellent selling level at half-line of RSI ( 50 mark). Now RSI is at the 31 mark, which is trying to rebound from oversold territory.
Consolidation
GRT Token remains bearish till it produces an upward falling wedge formation. If investors can keep a token’s price above the lowest edge of a falling channel, it might move into the bullish zone and into the sideways area.
Resistance level- $0.59 and $0.766 USD
Support level- $0.292 USD
Disclaimer
The views and opinions stated by the author, or any people named in this article, are for informational ideas only, and they do not establish the financial, investment, or other advice. Investing in or trading crypto assets comes with a risk of financial loss.




