
 Boomer
 hi
hi Claudia
 Covenant x402
 Quantus
 Pearl
Pearl NEAR Protocol
- KDA Token price is in a strong downtrend, and as it seems, it will stop at the long term demand zone.
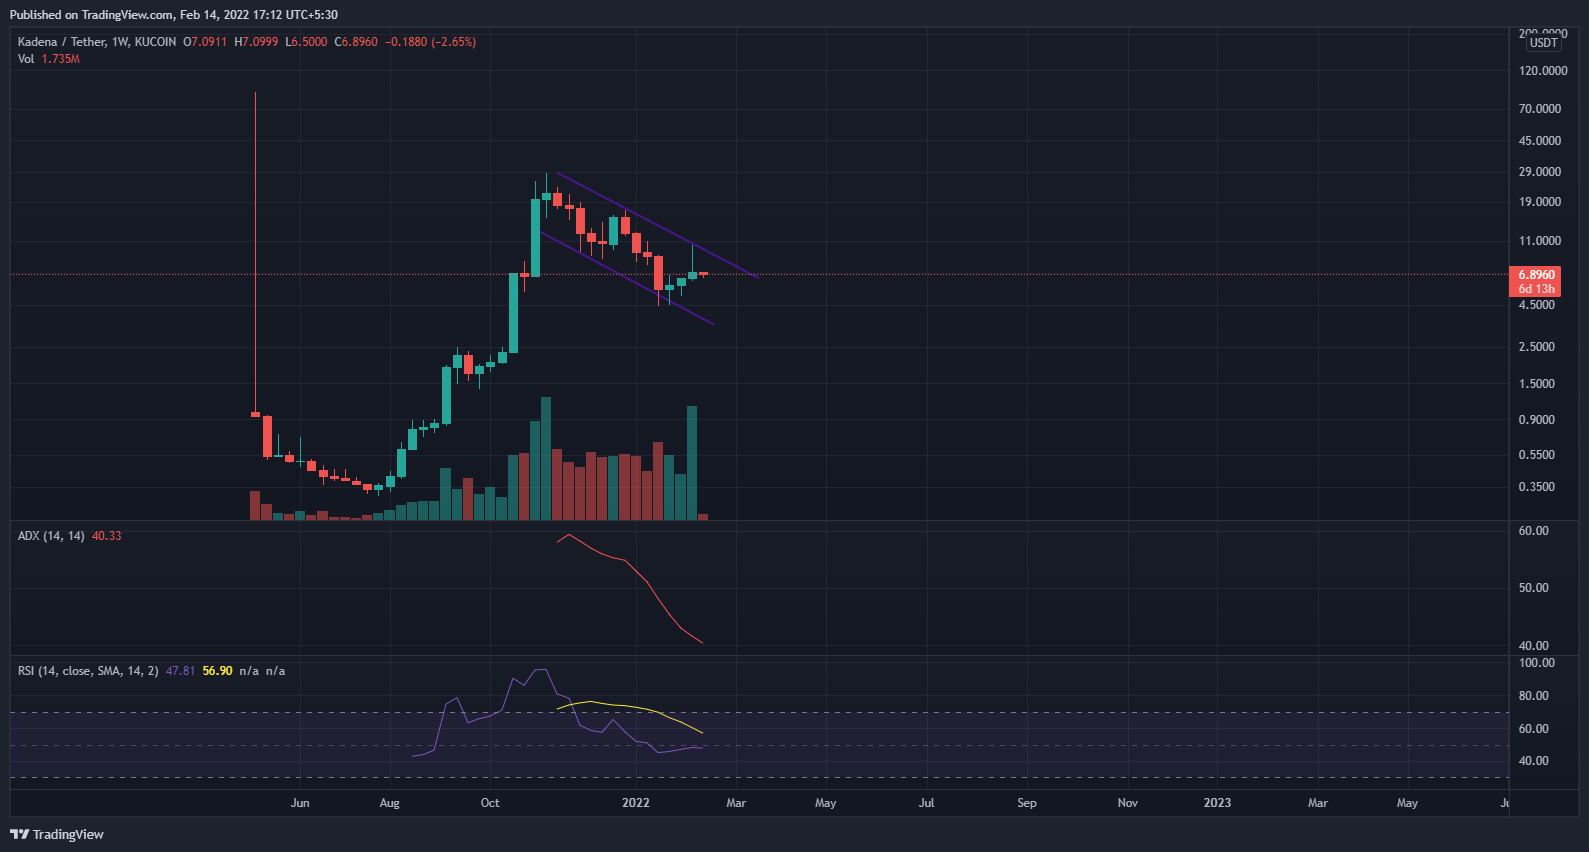
- The token forms a bullish flag and pole pattern on a weekly timeframe.
- The pair of KDA/BTC is trading at 0.0001634 with a decrease of -2.88% in the market cap of the digital asset over the past 24 hours.
Source: KDA/BTC by tradingview
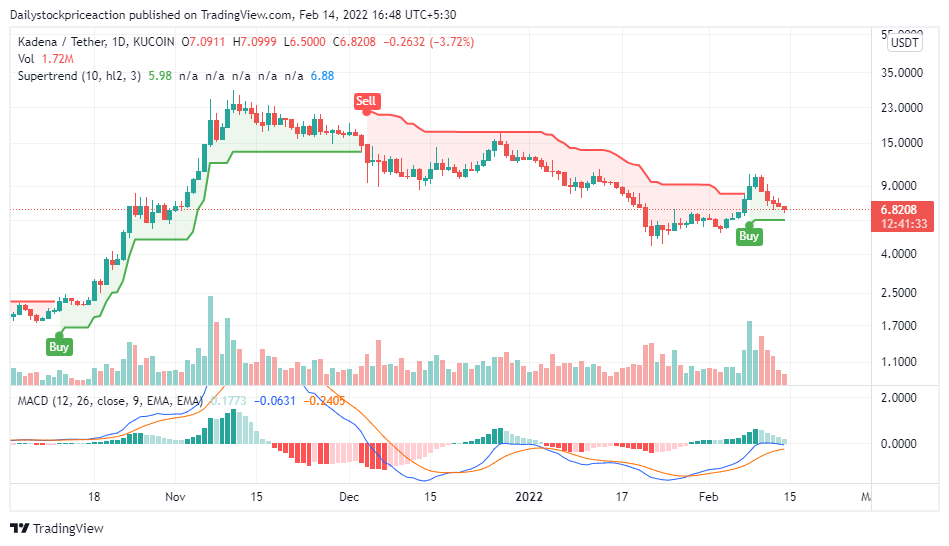
KDA Token has been in a strong downtrend for the past couple of trading days. The token fell after forming a big bearish engulfing candle on the daily chart. KDA token has been trading in the downward parallel channel over the past three weeks. The token forms lower low and lower high formation, indicating a bearish trend on bigger aspects.KDA token is trading below 50 and 100 EMA. The token recently gave a breakout of 50 and 100 EMA, but it happened to be a fake breakout as the price immediately came down below the breakout level. The token was trading at the upper band of the Bollinger band indicator, and after facing rejection, it is now falling. At present, the token is taking support at 20 EMA. Volumes are flowing from both the buyers and the sellers. It seems the bears have taken control after the fake breakout as the volumes have increased rapidly afterwards.
MACD and Supertrens are showing bullish signs despite the fake breakout
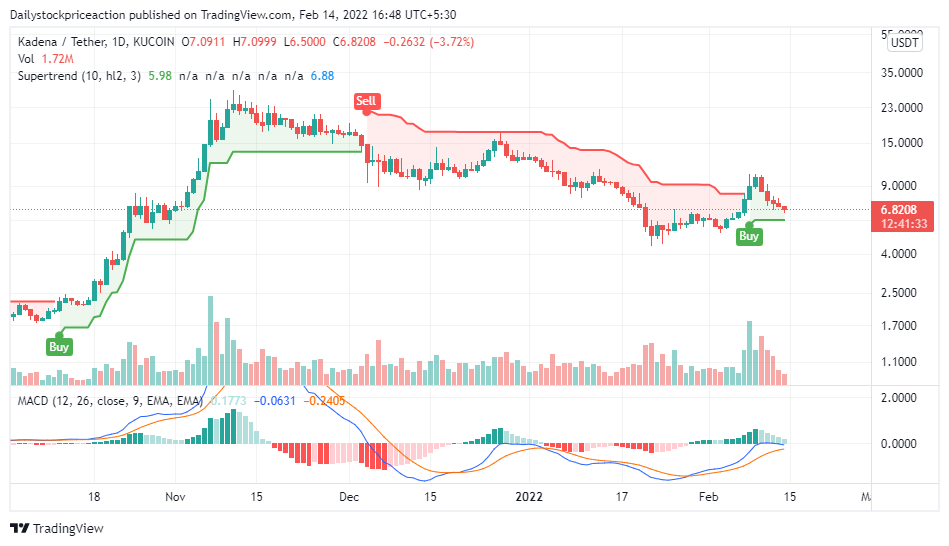
KDA token prices, despite the fall in the price of the digital asset, are getting bullish signs of the technical parameters.
Moving Average Convergence Divergence (Bullish): MACD indicates a bullish trend on the daily time frame as it gave a positive crossover. The buyer’s (blue) signal line crossed the seller’s (orange) on the upside. If the token bounced off the 20 EMA, the token price could reach up to$10.42.
Supertrend: Recent bearishness in the price of the KDA token has not affected the super trend indicator. The buy signal from the supertrend indicator is still intact. KDA token price can take support of the super trend trendline at $6.01, forming green long wick rejection candles at the support.
KADENA Token price is forming a bullish flag and pole pattern on a weekly time frame
Source: KDA/BTC by tradingview
KDA Token price is forming a bullish Flag And Pole Pattern on the weekly timeframe. The token formed a big wick rejection candle at the long term supply ozone of $9.49, indicating no bullish momentum for upcoming trading days.
Average Directional Movement Index: ADX has been continuously dipping from the past trading days, and recently, it slipped below 30, as the token faced rejection at $9.49.The ADX curve is still in a downtrend and suggesting a further fall in the price of the KDA token.
Relative Strength Indicator: RSI is trading at 47.90 after the token faced rejection and fell. The RSI curve fell out of the overbought zone and is also downtrend since the token started falling. The token has already fallen below the halfway mark of 50, and now the token price can fall to $4.5. The RSI curve has crossed the 20 SMA curve, indicating a bearish trend for upcoming days.
Conclusion
The token price is falling after facing rejection at $9.4 of 50 and 100 EMA. The token price will fall further down if it does not take support of 20 EMA and move up. It remains to see if the token is able to move up or bears trample down the price to $4.5.
SUPPORT: $4.3 and $4.5
RESISTANCE: $9.4 and $ 9.5
Disclaimer
The views and opinions stated by the author, or any people named in this article, are for informational ideas only, and they do not establish the financial, investment, or other advice. Investing in or trading crypto assets comes with a risk of financial loss.




